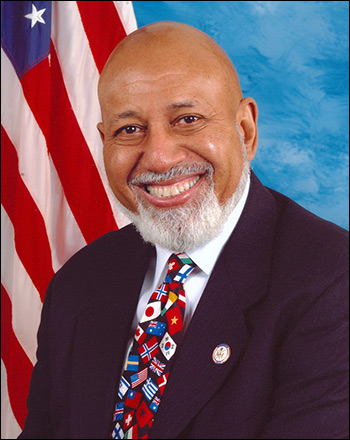
Tag Archives: Florida

New Mason-Dixon Poll Shows
Rubio’s Re-Election Potential

By Jim Ellis

Florida Sen. Marco Rubio (R)

March 11, 2021 — Mason-Dixon Polling & Strategy completed a new Florida political poll testing Sen. Marco Rubio’s (R) standing as he begins to construct a re-election campaign for a third term.

Though M-D did not test Sen. Rubio against another potential opponent, either Democratic or Republican, they did ask whether the respondents would vote to re-elect him.

The poll, conducted during the Feb. 24-28 period, asked a sampling universe of 625 Florida registered voters a series of questions about Sen. Rubio and President Joe Biden. The results identified areas of political strength and potential weakness for the Republican senator and contrasted them with those for the new president.

According to the data, Sen. Rubio posts a 47:42 percent positive job approval rating statewide. This compares to President Biden already landing in slight upside-down territory, 47:49 percent.

Asking whether the respondents would vote to re-elect Sen. Rubio, by a margin of 46-40 percent, the sampling group participants said they would. Region, gender, age, ethnicity, and party registration segmented the respondent universe.

Comparing Sen. Rubio and President Biden’s numbers, the results were almost exactly opposite. From geographic regions, Sen. Rubio recorded positive numbers in north and central Florida, the Tampa Bay area, and southwest Florida. He was upside-down in the southeastern part of the state. For President Biden, his disapproval scores outpaced his approval ratings in all but southeast Florida.

In terms of gender, President Biden does better with women than men (49:46 percent, female; 45:53 percent, male), while Sen. Rubio is much more positive with men (51:39 percent, male; 44:45 percent, female). President Biden does well with those 50 years of age and younger (51:44 percent positive), while he falls into negative territory with those aged 50 and older (44:53 percent). Again, Sen. Rubio scores the exact opposite (39:48 percent, <50; 54:37 percent, >50).

In the race segment, it is not surprising that President Biden’s strongest group was blacks, where he scored an 86:9 percent favorability rating. Among whites, the president was upside-down, recording a 38:59 percent negative ratio. Again, unsurprisingly, Senator Rubio performed in the opposite manner. He posted a 51:39 percent approval ratio with whites and a negative 15:69 percent ratio with blacks.

Continue reading

More Redistricting Delays

By Jim Ellis

Jan. 29, 2021 — The Census Bureau announced at mid-week yet another postponement in releasing the national apportionment figures, this time until April 30. Reapportionment should have been completed by Dec. 31, but the Bureau previously announced that March 6 would be the new release date due to COVID-related problems. Now, we see further delays.

Reapportionment is the process of creating a new census data algorithm in order to project the number of congressional seats each state will be awarded for the coming decade. It appears that 10-12 seats could change states, with the northeast and Midwest typically losing districts to southern and western states. This time, however, California, for the first time in history, is reversing their trend and appears headed for the losing list.

Once the apportionment numbers are known and the individual data dispersed, the states can begin the redistricting process. The Census Bureau further stated that individual states won’t be receiving their particular data necessary for redistricting until at least July 30. This will clearly set the redistricting cycle back significantly, which could cause major problems for the coming election cycle.

In the past, the Census Bureau has prioritized the states with early primaries to be first to receive their data. This meant that New Jersey and Virginia initially received their new population numbers ahead of the others because they have odd-numbered year state legislative elections. Texas and Illinois were next to receive since they traditionally schedule their regular primaries in March of the election year.

Knowing that the numbers would not be available for them in 2021, New Jersey and Virginia took preparatory action. Garden State officials placed a referendum on the November ballot asking voters for approval to postpone legislative redistricting until 2023. The measure passed.

The Old Dominion leaders decided they would run their 2021 state Delegate elections on the amended 2011 map but could conceivably call elections again for next year once they receive their updated data and can draw district boundaries. Virginia state senators do not stand for election until 2023, so it is unlikely the redistricting delay will affect those campaigns.

The data distribution and processing delay could place most legislatures in a conundrum. Most will be adjourned when the data is received, so special sessions will have to be called in most cases to complete the process prior to the 2022 candidate filing deadlines. This suggests that the states having redistricting commissions might prove to be in better position to complete the task because they won’t have to deal with legislative politics, priorities, or calendars, all of which result in a lengthy process.

Additionally, since almost every map is challenged in court, we could well see a plethora of lawsuits being filed late in the year that keep the redistricting process tied in figurative knots for months.

The states in the most difficult situations will be those gaining and losing congressional representation. Because the number of districts these particular states will have differ from their current allotments, they do not have the option of reverting to the current map once 2021 apportionment becomes final.

In the case of gainers and losers not having completed maps, we may see at-large races for the House. This would be particularly difficult for the losing states because we may see all members in the affected places having to run at-large for seats in their House delegations.

Unofficially, the gaining states appear to be Texas (3 seats), Florida (2), Arizona, Colorado, Montana, North Carolina, and Oregon. The losers may be New York (possibly 2 seats), Alabama, California, Illinois, Michigan, Minnesota, Ohio, Pennsylvania, Rhode Island, and West Virginia. Reports suggest that the closest developing situation concerns whether Alabama loses a seat or New York drops two.

President Biden’s executive order that mandates non-citizens be counted in the census will certainly affect the final data projections and may be another reason for this latest delay.

The only certainty about 2021 reapportionment and redistricting is the many moving parts in these various states will likely produce surprising political results.

Early House Outlook – Part IV

By Jim Ellis

Jan. 24, 2021 — Concluding our electoral US House preview, today we look at the final dozen states in the country’s southern region.


• Alabama – 7 Seats (1D6R)

Alabama is on the cusp of losing one of its seven seats in reapportionment. Sources suggest the final numbers are very close and the state may sue over how the figures are tabulated should apportionment take away one of the Republican seats. The Democrats have only one CD in the state, which is a majority minority seat (Rep. Terri Sewell-D) that is a certainty to remain as part of the delegation.

Should Alabama lose a seat in reapportionment, the state’s southeastern region, most particularly the Montgomery anchored 2nd District, would probably the most affected since this is the least populated area of the seven CDs.


• Delaware – 1 Seat (1D)

The home of new President Joe Biden was once a relatively conservative state, but no longer. Delaware is growing but won’t come anywhere near gaining a second seat. Therefore, three-term Rep. Lisa Blunt Rochester (D-Wilmington) will have an easy electoral ride for the foreseeable future.


• Florida – 27 Seats (11D16R)

The Sunshine State is one of two entities perched to gain multiple new districts. Florida is projected to add two seats, which should give the GOP map drawers the opportunity of protecting the newly won South Florida District 26 (Rep. Carlos Gimenez) and 27 (Rep. Maria Elvira Salazar) while maximizing the Republican compilation of Florida seats. Winning the aforementioned Miami-anchored CDs might result in conceding one of the new seats to the Democrats, however, in order to off-load a significant portion of their left-of-center voters, which would make both seats more Republican.

Holding the governor’s office, both houses of the legislature, and now a majority on the state Supreme Court will allow the GOP to become the big winner in redistricting. The fact that 25 of the 27 districts are over the estimated per district population projection of approximately 740,000 residents provides statistical evidence for expanding the delegation.

Rep. Darren Soto’s (D-Kissimmee) 9th District is the most over-populated seat with more than 931,000 people. Only Reps. Neal Dunn’s (R-Panama City) and Charlie Crist’s (D-St. Petersburg) seats are slightly below the projected population target. Twelve of the current 27 districts now hold more than 800,000 constituents. Expect the new seats to be added in South Florida, most likely toward the Gulf Coast side of the peninsula, and in the Orlando area.


• Georgia – 14 Seats (6D8R)

Though Republicans will control the redistricting pen as a result of holding both the legislature and governor’s office, the party map drawers will be hard-pressed to construct a map that allows their members to dominate the delegation as they did 10 years ago. Gaining a seat in 2010 reapportionment, the GOP began the decade with a 10-4 advantage in the House delegation only to see two Atlanta suburban seats slip away as a result of demographic and political changes in the metropolitan area.

Georgia is expected to remain constant in this reapportionment with their 14 seats. The GOP will attempt to make at least one of the seats they lost, District 6 (Rep. Lucy McBath) or District 7 (Rep. Carolyn Bourdeaux) more Republican and thus give themselves a chance to re-claim a seat for the coming decade.

Expect a move to make one of these two seats, probably District 6, more Democratic in order to make District 7 more Republican especially since the latter CD is the most over-populated seat in the state with more than 844,000 residents and will have to shed close to 90,000 individuals to other districts.
Continue reading

Early Senate 2022 Previews:
Florida & North Carolina

By Jim Ellis

Jan. 14, 2021 — Regardless of how many in-cycle Senate seats – there are 34 in the 2022 election cycle – come into political play, we can count on seeing Florida and North Carolina once again hosting crucial battleground campaigns.

Florida is always consistent in their close vote totals, particularly when remembering the 2000 presidential campaign — and pollsters, while typically forecasting tight finishes, have often missed the outcomes. In fact, the cumulative polling community has predicted close Democratic victories in the last four key statewide elections: two presidential (2016 & 2020), one senatorial (2018), one gubernatorial (2018), and been wrong on each occasion.

Since 2016, inclusive, Florida has hosted eight statewide races with Republicans winning seven. Yet, their average cumulative vote percentage for these eight victorious campaigns was just 50.7 percent, with the high point being 52.0 percent (Sen. Marco Rubio-R, 2016). Democrats recorded the low winning total: 50.04 percent — 6,753 votes from 8,059,155 votes cast; agriculture commissioner, 2018; winner Nikki Fried (D) vs. Matt Caldwell (R). The aggregate average among the statewide contests in these three most recent election years is 50.7 – 47.9 percent in the GOP’s favor.

With this background, Sen. Rubio will presumably seek a third term next year against what will surely be a highly competitive Democratic opponent. At this point, most of the speculation surrounds two Democratic House members, neither of whom has closed the door on either running for the Senate or challenging Gov. Ron DeSantis (R) as he seeks a second term.

Reps. Stephanie Murphy (D-Winter Park) and Val Demings (D-Orlando) are the two most prominently mentioned prospective contenders, and it wouldn’t be surprising to see one run for Senate and the other for governor. It is less likely that we would see a primary developing between the pair in one of the races.

Other names being floated are Rep. Charlie Crist (D-St. Petersburg), who is always mentioned as a potential statewide candidate because he previously served both as attorney general and governor and lost two other statewide campaigns. Other potential contenders are Rep. Ted Deutch (D-Boca Raton) and former Rep. Debbie Mucarsel-Powell (D-Miami). The state’s lone Democratic office holder, Agriculture Commissioner Nikki Fried, is more often associated with running for governor as opposed to the Senate contest.

Continue reading

Florida Data

By Jim Ellis

Dec. 18, 2020 — Continuing with our project this week of analyzing statewide data now that official final election results are being published from around the country, today we look at the Sunshine State of Florida, another key redistricting state.

Though having only three-quarters of Texas’ population, the Florida presidential turnout came within only a few hundred to equaling that of the Lone Star State (FL: 11,067,366; TX: 11,315,056).

On the statewide tally, President Trump carried Florida with a 51.2 – 47.5 percent margin over former vice president Joe Biden. The result represents a net 2.2 percentage increase for the president when compared with his 2016 statewide total, while Biden’s performance registered a decline of 0.3 percent from Hillary Clinton’s Sunshine State aggregate vote.

The House performance detected in California and Texas, showing that the average victorious congressional candidate performed better within their particular district than President Trump, was not nearly as pronounced in Florida.

On average, Texas US House Republican candidates ran 2.8 percentage points better than Trump, and the average California GOP House candidate ran 4.2 points ahead of the president’s statewide percentage. In Florida, however, the number was virtually equal to the president’s, with the average House Republican contender running just 0.2 percent above Trump’s statewide total.

Because two of the Republican incumbents, Reps. Neal Dunn (R-Panama City) and Mario Diaz-Balart (R-Miami/Hialeah), ran either without Democratic opposition (Dunn) or totally unopposed (Diaz-Balart) the Florida Secretary of State does not record votes in such a district. Therefore, for purposes of this exercise, a projected result of 65-35 percent for the two congressional districts was added as an estimated total. This percentage spread was extrapolated when comparing the performance of Republican and Democratic congressional candidates in similar Florida districts.

To review, in California, Democratic House incumbent performance fell below their 2018 recorded vote in 33 of 44 districts, while results improved for four of the six Republican incumbents on the ballot. In Texas, vote percentages for 11 of the 16 Republican incumbents seeking re-election improved from 2018, while the Democratic incumbent performance index declined for all 13 who ran for a succeeding term.

Continue reading

The Early Vote Predictor

By Jim Ellis

Dec. 3, 2020 — While it became clear that the plethora of polling data published during the 2020 election cycle again proved to be a poor predictor of eventual campaign outcome in most states, another resource was discovered that might be the more reliable prognosticator.

The states releasing early voting numbers before the election – not the actual election results, of course, but the numbers of Democrats, Republicans, and Unaffiliated voters who had returned their ballots – provided the opportunity of charting possible race outcomes. As a predictor, the early voting numbers, largely because they are actual votes and not extrapolations and estimates as found in polling, look to be a more reliable gauge.

Let’s examine the results in the key battleground states and compare them to both the 2020 and 2016 early voting numbers as compiled by the Target Smart organization. Target Smart monitored, categorized, and published the early ballot return numbers throughout the acceptance period in every state that publicly released such data. Unfortunately, for purposes of our exercise, the Georgia 2020 numbers are among the states not currently available.

In Arizona, we see a difference in the 2016 and 2020 early vote numbers that indicated a small shift in the voting patterns. Detecting that Democratic early vote participation had increased several points from four years ago while Republicans were down slightly did prove indicative in relation to the final Arizona result that yielded an official 10,457 vote Biden victory.

In Florida, we see the Democratic early vote numbers dropping slightly. This is a bit surprising in that 2020 featured a record voter turnout. The fact that Republicans gained a bit in the swing was a predictor of President Trump’s stronger performance in the Sunshine State as compared to the result from four years previous.

As we can see from the Michigan numbers, Democrats increased their early voting participation while Republicans saw a decrease. Unaffiliated voters substantially increased. Considering the final result, it is apparent that most of the Unaffiliateds voted Democratic in the presidential contest.

The North Carolina early vote numbers gave us our first clear indication that the pollsters were mis-casting the state’s electorate. The clear indication that Democrats were missing their marks in early voting while Republicans were exceeding their expectations was the first indication that the final vote would produce a different result than the plethora of polls were suggesting.

Pennsylvania featured drastic changes in not only the partisan early vote pattern, but also in volume as early voting increased by more than twelve-fold in comparison to 2016. The stark difference in Democratic versus Republican participation levels did forecast a swing to the former party, though the final totals were not as drastically different as the early voting yields.

Continue reading

Presidential Polling Report – Part II

By Jim Ellis

Nov. 30, 2020 — Last week, we covered the cumulative polling community’s 2020 accuracy in the Great Lakes region (scroll down below), and today we look at how their predictions fared in President Trump’s five core states of Arizona, Florida, Georgia, North Carolina, and Texas. If the President had been able to carry all five states, and he has now officially failed in Arizona and Georgia, he would have only needed to win one of the battleground state bordering a Great Lake to secure re-election.

In each place, we take the five publicly released polls conducted closest to the election and analyze whether the cumulative and individual survey research firms came close to the final result or missed beyond the polling margin of error.


Arizona

Canvassing is not yet complete in Arizona, but it appears Mr. Biden scored a 49.4 to 49.1% victory, a margin of just 10,457 votes. Carrying Arizona was the first conversion step for Mr. Biden to win the national election.

The final five pollsters were the NBC News/Marist College; CNBC/Change Research; Reuters/Ipsos, Emerson College, and Rasmussen Reports. Here, NBC/Marist came the closest, predicting the two candidates landing in virtually a dead heat. All five, however, were within the polling margin of error, though Rasmussen Reports did call the winner wrong, predicting President Trump would carry the state by four percentage points.

Arizona – Biden 0.3 percent

NBC News/Marist 10/29 – 11/1 717 LV 48 48 Tie
CNBC/Change Research 10/29 – 11/1 409 LV 50 47 Biden +3
Reuters/Ipsos 10/27 – 11/1 610 LV 49 47 Biden +2
Emerson 10/29 – 31 732 LV 48 46 Biden +2
Rasmussen Reports 10/27 – 29 800 LV 45 49 Trump +4

Florida

Cumulative polling predictions again projected a close Democratic win during most of the late election cycle only to see, for the fourth consecutive time in a major Florida statewide race, the Republican candidate reversing the trend and clinching a close win. The latest Florida data was much closer to the mark as three of the final five pollsters correctly forecast a win for President Trump.

The Trafalgar Group proved the closest with their Trump +2 final projection. CNBC/Change Research missed by the most, a six-plus point swing from their Biden +3 prediction to a Trump +3.3 final result.

The final five Sunshine State pollsters were: Fox 35/Insider Advantage; the Trafalgar Group; CNBC/Change Research; Susquehanna Polling & Research; and Rasmussen Reports.

Florida – Trump 3.3 percent

FOX 35/Insider Adv 11/2 400 LV 47 48 Tie Trump +1
Trafalgar Group 10/31 – 11/2 1003 LV 47 49 Tie Trump +2
CNBC/Change Research 10/29 – 11/1 806 LV 51 49 Tie Biden +3
Susquehanna 10/29 – 11/1 400 LV 46 47 Tie Trump +1
Rasmussen Reports 10/29 – 31 800 LV 48 47 Tie Biden +1

Georgia

Just about everyone missed the final count in Georgia, though pollsters throughout the election cycle were clearly forecasting a close Peach State race that certainly ended in such a manner. With the race now certified, Biden won the state, 49.5 to 49.3 percent, a margin of just 12,670 votes.

The only pollster to correctly predict a Biden victory was Public Policy Polling, while the Trafalgar Group, despite being closest in Arizona, was furthest away in Georgia. The five pollsters were: WSB-TV/Landmark Communications; the Trafalgar Group; Insider Advantage; Emerson College; and Public Policy Polling.

Georgia – Biden 0.2 percent

WSB-TV/Landmark 11/1 500 LV 50 46 Trump +4
Trafalgar Group 10/31 – 11/2 1013 LV 50 45 Trump +5
Insider Advantage 11/1 500 LV 48 46 Trump +2
Emerson 10/29 – 31 749 LV 49 48 Trump +1
PPP 10/27 – 28 661 LV 46 48 Biden +2

North Carolina

North Carolina, being one of the quintessential swing states in the country, again produced a close race in 2020 as President Trump claimed the Tar Heel State with just a 1.3 percentage margin, 49.9 – 48.6 percent. Rasmussen Reports was again closest to the mark, as they were in Pennsylvania. Most of the polling throughout the entire election cycle, however, 57 of 85 published polls with eight ties, forecast Biden as holding a North Carolina lead.

The five final pollsters were: Insider Advantage; CNBC/Change Research; Emerson College; Reuters/Ipsos; and Rasmussen Reports. While RR was the closest, CNBC/Change Research was furthest away.

North Carolina – Trump 1.3 percent

Insider Advantage 10/30 – 31 450 LV 48 44 Trump +4
CNBC/Change Research 10/29 – 11/1 473 LV 47 49 Biden +2
Emerson 10/29 – 30 855 LV 47 47 Tie
Reuters/Ipsos 10/27 – 11/1 707 LV 48 49 Biden +1
Rasmussen Reports 10/28 – 29 800 LV 48 47 Trump +1

Texas

Media report after media report continued along the theme that the Lone Star State of Texas was in play for Biden but, in the end, Texas remained red and voted for President Trump in a 5.5 percentage spread, 52.0 – 46.5 percent, which was the closest major statewide race in nearly two decades.

At the end of the race, the pollsters were detecting a clear move toward President Trump largely because the oil and gas industry issues, so important to the Texas economy, became the focal point of attack throughout most of the campaign.

The University of Houston poll called the race almost exactly correct, while two academic institution pollsters, Emerson College and Quinnipiac University, were furthest away. The five pollsters were: Emerson College; University of Massachusetts at Lowell; Siena College/New York Times; Quinnipiac University; and the University of Houston.

Texas – Trump 5.5 percent

Emerson 10/29 – 31 763 LV 49 49 Tie
UMass Lowell 10/20 – 26 873 LV 48 47 Trump +1
Siena College/NYT 10/20 – 25 802 LV 47 43 Trump +4
Quinnipiac 10/16 – 19 1145 LV 47 47 Tie
University of Houston 10/13 – 20 1000 LV 50 45 Trump +5

ME-2

For the second time in two presidential elections, the 2nd Congressional District of Maine bucked the statewide trend and supported President Trump. Biden’s larger margin in the ME-1 CD allowed him to carry the statewide count, which earned him three of Maine’s four electoral votes.

As in the US Senate election in which the polling community missed the final result by the largest margin in the country, so too did they underestimate President Trump’s strength in northern Maine.

All five final pollsters forecast a Joe Biden victory in ME-2, but the end result was a substantial win for President Trump. Each missed well beyond the polling margin of error. The five polling firms were: Change Research; Emerson College; Survey USA; Colby College; and Pan Atlantic Research.

ME-2 – Trump 7.9 percent

Change Research 10/29 – 11/2 475 LV 47 46 Biden +1
Emerson College 10/29 – 31 301 LV 50 47 Biden +3
Survey USA 10/23 – 27 509 LV 48 45 Biden +3
Colby College 10/21 – 25 453 LV 46 42 Biden +4
Pan Atlantic Research 10/2 – 6 300 LV 47 43 Biden +4