Category Archives: Redistricting

Re-Mapping Ohio

Ohio’s Congressional Districts


By Jim Ellis

July 21, 2021 — Thanks to the state of Ohio, the redistricting calendar has new life. The Buckeye State’s lawsuit against the Census Bureau and a negotiated out of court settlement led to an agreement that all 50 states will receive their redistricting census tract data on or around Aug. 15 instead of well into October or beyond.

Typically, states receive their individual data, mandatory for drawing federal congressional districts that must be drawn to a factor of plus or minus one person, during the early part of the year. The Census Bureau largely blames this year’s delays on COVID-19, though a great deal of the problem centers around the bureaucracy attempting to impose differential privacy on part of the data, meaning some of the key statistical information would not be released. The states not having full access would lead to the new districts being less statistically reliable.

Even the August data distribution agreement, however, creates a tenuous situation for the states to complete their redistricting work and still adhere to mandatory internal local deadlines. This is particularly true for the states like Ohio that are losing or gaining congressional representation.

Ohio grew at a percentage rate of just 2.3 through the decade, ranking 44th in the nation and just over a full percentage point below the national average. The 2020 census numbers add to the continuing trend for this state of failing to keep pace with national population growth. In the 1980 census, for example, Ohio held 21 congressional districts. It would lose two congressional seats in the 1990 apportionment, one more in 2000, and two more in 2010 to bring us to its current total of 16. The 2020 census reduces the delegation to 15 seats.

Currently, the Ohio US House delegation stands at a party division of 12R-4D. Since the count is so lopsided in the Republicans’ favor, it looks on paper that the GOP would be the party that loses one of its members.

Looking closely at the individual district population data, however, that may not be the case. Despite the Dems having only four seats, three of their four are among Ohio’s most under-populated CDs, while one, the 3rd District of Rep. Joyce Beatty (D-Columbus), actually must shed the most population, some 34,000-plus residents according to the latest published figures (July 2019). Adding the last year of population statistics could change the situation, but at first glance the statewide and district totals suggest alterations will only be minor.
Continue reading →
The Michigan Wild Card

Michigan Congressional Districts


By Jim Ellis

July 16, 2021 — For the third consecutive census, the Wolverine State of Michigan loses a congressional seat but this time it is more difficult to determine how the new map will be drawn and which of the state’s 14 US House members, comprised of seven Democrats and seven Republicans, will be the odd member out.

The big change is that for the first time a citizens’ commission, and not the state legislature, will draw the map. The 13-member commission has been conducting briefings to organizations around the state since April 3 and has public input meetings scheduled with those that began July 8 through Aug. 26.

What places Michigan in a wild card situation, however, won’t become clear until the US Census Bureau sends the state its individual tract data that will arrive on or around Aug. 15. At that point, the key question will be answered as to just how many people the city of Detroit has lost. This will be the critical factor in determining how the new congressional map is constructed.

Like every state, Michigan is bordered on all sides meaning the members with districts on the edge are typically in better defined position than those residing in the geographic middle. In this state’s case, the Great Lakes surround the split land masses on the north, east, and west, with Canada lying to its north and east, and Indiana and Ohio to the south.

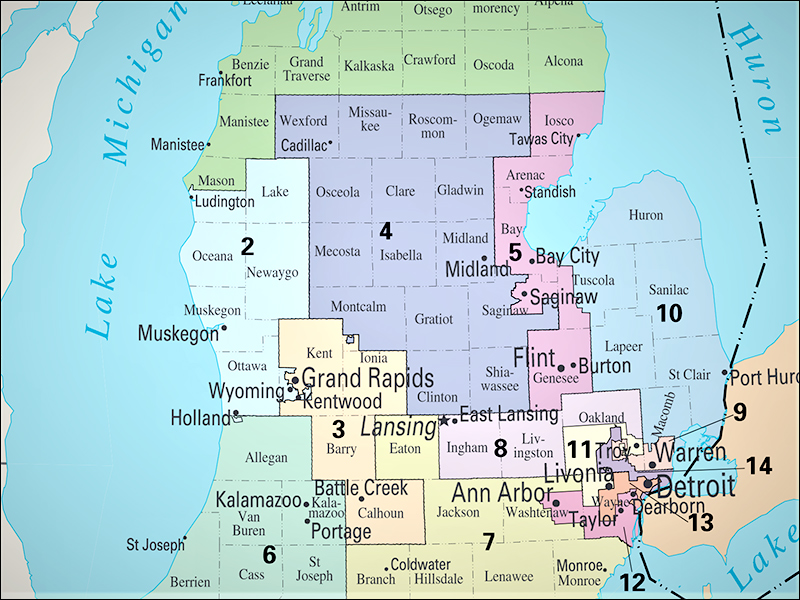
Looking at the available public population data that only is current through July 1 of 2019, all current 14 districts must gain residents, hence the state losing a CD, with three most significantly holding the fewest people. Those three are the two Detroit seats, Districts 13 (Rep. Rashida Tlaib-D) and 14 (Rep. Brenda Lawrence-D), and the Flint-anchored seat, District 5 (Rep. Dan Kildee-D). All three are likely to need an influx of more than 100,000 people apiece.

Continue reading →

House Vulnerables – Part II

By Jim Ellis

July 13, 2021 — On Monday, we began a two-part series on what are arguably the most vulnerable dozen US House seats based upon the individual district’s political performance over the past two elections.

Below is the priority order update covering the second half of the top 12 most vulnerable CDs. As you will continue to see below, all of the seats except one are Republican held.

To refresh, the first six covered were:

• IA-2 (Rep. Mariannette Miller-Meeks, R-Ottumwa)
• IA-1 (Rep. Ashley Hinson, R-Marion/Cedar Rapids)
• IA-3 (Rep. Cindy Axne, D-Des Moines)
• FL-27 (Rep. Maria Elvira Salazar, R-Miami)
• CA-48 (Rep. Michelle Steel, R-Orange County)
• NY-22 (Rep. Cynthia Tenney, R-New Hartford)

Here’s our look at the next six:

UT-4: Rep. Burgess Owens (R-Salt Lake City) – Ave R vote: 48.8%
• Former NFL football star and businessman Burgess Owens defeated freshman Rep. Ben McAdams (D) by one percentage point in 2020, and we can expect another competitive race here again within this mostly suburban Salt Lake City congressional district located in the metropolitan area’s southern sector.

Republicans, who are in full control of the Utah redistricting process, will attempt to improve the district for Owens, which is possible since the 4th CD is the fastest growing district in the fastest growing state over the past decade. The best estimates suggest that the 4th District must shed approximately 50,000 people to other CDs. This should allow map drawers to subtract a substantial number of Democratic voters from the district, thus yielding Burgess a slightly more favorable political domain.

At this point, McAdams, who was the Salt Lake County mayor prior to his election to Congress, has not indicated whether he will return for a re-match.

MN-1: Rep. Jim Hagedorn (R-Rochester) – Ave R vote: 49.3%
• Two-term Rep. Hagedorn just announced that his cancer has returned, meaning an immediate treatment regimen. How this will affect his re-election campaign is yet to be determined. Hagedorn has won two close elections, as has his Democratic colleague in the adjacent district, Rep. Angie Craig (D-Eagan).

Minnesota is the only state in the nation that sees a split control legislature, meaning each party controls one house. Since the state did not lose a congressional district in apportionment as originally projected, it would not be surprising to see a legislative deal made where Democrats and Republicans are flipped between the two adjoining districts. The changes would result in Hagedorn gaining Republicans and Craig adding Democrats. Redistricting will perhaps be the most critical factor in determining the outcome of both districts come 2022 and beyond.

Continue reading →

House Vulnerables – Part I

By Jim Ellis

July 12, 2021 — Much of the early 2022 election cycle narrative places the Republicans in an advantageous position to re-claim the US House majority they lost in 2018, but there are mitigating factors that make predicting such an outcome premature.

To begin, analysts cite the historical voting pattern that yields large midterm losses for the party that wins the White House in the previous election – a mean average House seat loss of 25 for the president’s party in the first midterm in the 11 such elections from Eisenhower in 1954 to Trump in 2018 – which is a key influence factor for the 2022 election cycle.

Since we are immediately following a new census, redistricting will change at least to a small degree all of the districts in the 44 states that will have more than one seat. Most analysts believe Republicans will be at least slight beneficiaries of the new maps because their party controls most of the state legislatures that will draw the new lines.

The states, however, do not yet even have their census tract data and won’t until mid-August at the earliest; therefore, redistricting will be later and even more chaotic than we are accustomed to seeing. The delays could lead to more interim court maps being placed for the 2022 election, which could neutralize any gain the GOP achieves from their favorable position in the majority of state legislatures that have redistricting power.

Additionally, one must look at the 2020 race results to determine which of the seats will become major targets. In November, 53 current House members won their elections with less than 52 percent of the vote, 27 Democrats and 26 Republicans. In terms of the closest election results, and likely meaning the most vulnerable conversion targets for the 2022 re-election cycle, we see 11 Republicans in the 12 seats where the incumbent’s party averaged 50 percent of the vote or below in the previous two electoral contests.

This tells us that the national Republican strength factor heading into the midterm vote may be somewhat weaker than noted in a cursory overview.

Continue reading →

California’s Lost Seat

By Jim Ellis

July 7, 2021 — For the first time in history, California loses a congressional seat in reapportionment, and the public input session that was scheduled to begin yesterday continues the California Citizens Redistricting Commission’s Phase 2 process. This week, the commission members continue listening to testimony about how the districts should be drawn for the state’s congressional delegation and both houses of the Golden State’s legislature.

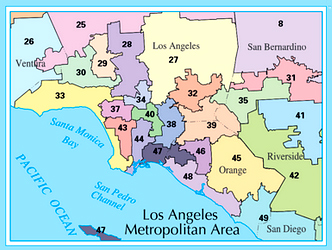
Sitting adjacent to each other are the following California congressional seats: CA-32 (Rep. Grace Napolitano; D-Norwalk), CA-38 (Rep. Linda Sanchez; D-Whittier), CA-40 (Rep. Lucille Roybal-Allard; D-Downey), and CA-44 (Rep. Nanette Diaz-Barragan; D-San Pedro).

After California, along with the other 49 states, receives its census tract information after the Aug. 15 negotiated deadline, the five Democrats, five Republicans, and four non-affiliated CCRC members will study and organize the data until their Phase 3 line drawing process commences in September. The commission was created through a 2010 ballot proposition that removed redistricting power from the legislature and instituted a citizens panel to create the new post-census maps every 10 years. This is the body’s second redistricting cycle.

The commission timeline was crafted after the state of Ohio sued the Census Bureau to force a faster distribution of the state redistricting data. Originally, using COVID as their principal excuse, the Bureau leadership set Oct. 1 as their distribution deadline goal. In typical years, states would have received the census tract information months ago. The Ohio lawsuit was settled with the two sides agreeing on an Aug. 15 deadline that is now in effect for the whole country.

The commission members are now tasked with changing the state’s 53-member congressional delegation into a map that features only 52 seats. And now, the question of just which area will lose the district must be tackled.

Looking at the latest public district data, that through July 1, 2019, we see some patterns providing key clues. It is understood that the last year of the census is not included in these numbers, and reports suggest that the final 12 months of the 10-year cycle resulted in significant change for the state as the number of people leaving for other places substantially increased. In fact, for the first time, California actually has fewer people than it did in a preceding year.

The most significant loss appears to come in central Los Angeles County. Looking at the current 53 districts, the seat with the lowest population is Rep. Adam’s Schiff’s (D-Burbank) San Fernando Valley 28th CD. But the cluster of seats in the heart of Los Angeles suggests an area where two seats can easily be collapsed.

Continue reading →

Oregon’s New Seat

Current Oregon US Congressional Districts Map


By Jim Ellis

July 2, 2021 — Oregon earned a sixth congressional seat in the 2021 apportionment, but exactly where that district will be placed on the Beaver State’s new map is not particularly obvious.

Like most states, Oregon handles redistricting through the legislative process and Democrats have firm control of all three legs of the legislative stool. In addition to Gov. Kate Brown (D), the party has a 18-11 margin in the state Senate with one Independent. Their majority in the state House of Representatives is similarly large, 37-22, with one vacancy. Yet, the partisan breakdown of the state might make drawing a solid 5D-1R map surprisingly somewhat difficult.

Currently, the five congressional districts are not obviously gerrymandered, as the seats are drawn in block form. Naturally, all but two cluster around the Portland metropolitan area, the state’s dominant population region.

The five incumbents are all senior, with Rep. Suzanne Bonamici (D-Washington County) being the most junior with her original election coming in a special 2012 contest. The delegation dean is House Transportation & Infrastructure Committee chairman Peter DeFazio (D-Springfield) who was first elected in 1986.

As you can see from the following chart, using 2019 population numbers since the Census Bureau will not be delivering census tract data to the states until after Aug. 15, the five districts are remarkably equivalent in relation to population size.

DISTRICT INCUMBENT 2020% POPULATION REG. VOTERS
1 BONAMICI 64.6% 858,875 570,186
2 BENTZ 59.9% 841,022 598,375
3 BLUMENAUER 73.0% 853,116 588,614
4 DeFAZIO 51.5% 820,504 588,508
5 SCHRADER 51.9% 844,220 578,609

The population figures suggest that each district will have to shed between 115,000 to 155,000 people in order to create six CDs with equal population, likely a number around 710,000 individuals for this state.

Continue reading →

Colorado Releases First New Map


District 1 – Rep. Donna DeGette (D-Denver)
District 2 – Rep. Joe Neguse (D-Lafayette/Boulder)
District 3 – Rep. Lauren Boebert (R-Silt/Western Slope)
District 4 – Rep. Ken Buck (R-Windsor/East Colorado)
District 5 – Rep. Doug Lamborn (R-Colorado Springs)
District 6 – Rep. Jason Crow (D-Aurora)
District 7 – New Seat
District 8 – Rep. Ed Perlmutter (D-Arvada/Thornton)


By Jim Ellis

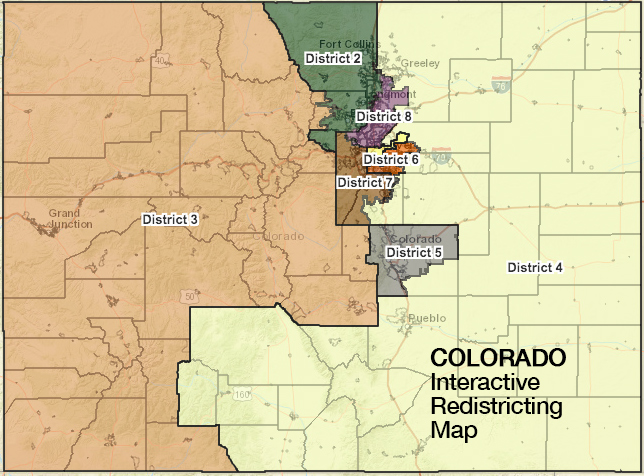
June 28, 2021 — The Colorado Independent Redistricting Commission, using only Census Bureau estimates because no state has yet received its census tract information and won’t until at least Aug. 15, released a preliminary new eight-district US House map late last week. Colorado is one of the states that gained a congressional seat under the 2020 national reapportionment.

The published commission map will not be the final version because population estimates and statistical sampling cannot be used for redistricting purposes per a 1999 US Supreme Court ruling (Department of Commerce v. US House of Representatives). Therefore, if this map is to become the basis for the actual plan, it will have to be adjusted after Colorado is presented with its census tract data.

This is the first redistricting cycle where Colorado has opted for the commission process. The new congressional map looks similar to the current seven-district design, in that the basic configurations of the seats and anchor population centers remain consistent with the notable exception of Rep. Ed Perlmutter’s (D-Arvada) current 7th District.

What appears designed as the new seat, District 8, takes a key population center from the 7th, the Arvada-Westminster-Thornton corridor, and makes it the new 8th CD anchor. This means the new 8th begins just north of Denver in Adams County and consumes about 85 percent of the local entity before moving slightly west to capture small Broomfield County and parts of Jefferson and Boulder counties. It then continues northeast to encompass a portion of Weld County.

Continue reading →

Census Delays: Some Ramifications

By Jim Ellis

June 1, 2021 — As we know, the Census Bureau has delayed in meeting its public reporting deadlines, which causes ramifications in the political world. As a result, the state officials responsible for redistricting could well find themselves placed behind the proverbial eight ball as the new year approaches.

Reapportionment is the term used to explain the entire decennial process. Reapportionment, as the US Supreme Court defined it in their 1999 ruling on the US Census Bureau v. House of Representatives case, is basically divided into two parts. The first, which was finally completed and released on April 26, is the allocation of congressional seats to the states. The second is the re-drawing of congressional, state, and local district boundaries most often referred to as redistricting.

To complicate matters even further, the delayed allocation proved much different – affecting six seats to be exact – than predictions. It was believed for at least two years that Texas would gain three seats in the 2020 reapportionment and Florida two, with Arizona, Colorado, Montana, North Carolina, and Oregon adding one seat apiece. The actual numbers found Texas gaining two, Florida one, and Arizona none. The other one-seat gaining states were correctly predicted.

Conversely, Alabama, California, Illinois, Michigan, Minnesota, New York, Ohio, Pennsylvania, Rhode Island, and West Virginia were all expected to lose one seat apiece. The actual report found Alabama, Minnesota, and Rhode Island each retaining the same number of seats they held in the 2010 reapportionment, while the others did lose a single district apiece.

The Census Bureau claims that COVID is largely responsible for their delays, but the state of Alabama, in their pending lawsuit against the federal statistical entity, disagrees. Alabama claims the deadline violations occurred because of the Bureau’s attempt to impose, for the first time in history, differential privacy over the data. This means, under the argument of protecting individual privacy, data would be deliberately scrambled, and certain information not publicly released.

Differential privacy alone would make redistricting extremely difficult for state map drawers because the released census tract numbers, now by definition, wouldn’t equal the state population figures brought forth earlier in the year. The effect would cause political havoc throughout the country. A court ruling on the Alabama case is expected shortly.

Because of a successful legal challenge from Ohio, the Census Bureau has agreed to make the data necessary for redistricting available to the states by Aug. 15 instead of the Oct. 1 date indicated when allocation was announced.

Continue reading →

Rep. LaHood Considering Judicial Bid

By Jim Ellis

Illinois Rep. Darin LaHood (R-Peoria)

May 25, 2021 — An interesting story is breaking in Illinois that involves four-term US Rep. Darin LaHood (R-Peoria). Reports suggest that the congressman is considering running for an open state Supreme Court position next year instead of re-election.

The move would make some sense in that winning the 3rd District Supreme Court position would appear to give Republicans a 4-3 majority on the judicial panel, the only area of power that the GOP would control in the state.

Considering the Illinois congressional map is a heavy Democratic gerrymander (13D-5R statewide) and will likely continue as such under a new 17-seat map (down one from the current 18) to be drawn when the Census Bureau reports the track data to the states, probability is high that the collapsed seat will be Republican and come from Illinois’ downstate region.

Though fewer people reside in the state of Illinois today than 10 years ago, the population loss appears greater outside the Chicago metropolitan area. Democrats, with their wide majorities in both houses of the state legislature, will assuredly capitalize upon the opportunity of collapsing two of the few remaining GOP seats into one. This means despite languishing in a severe minority, Republican congressional strength in the state will likely diminish even further.

Illinois is one of the few states that runs its Supreme Court elections by districts. Justices are initially elected in partisan elections for 10-year terms, and then must stand for a yes-no retention vote to secure succeeding terms. To win retention, a justice must receive at least a 60 percent yes vote.

Third District Justice Thomas Kilbride recorded only a 56.5 percent yes vote in the November election; therefore, he was defeated. His appointed replacement, Democratic Justice Robert Carter, has already said he will not seek a full 10-year term in 2022, meaning the position will be open for election.

Continue reading →

New Seat Location in North Carolina

North Carolina’s 12 Congressional Districts

By Jim Ellis

May 21, 2021 — With the new reapportionment map public and the states gaining congressional districts now certain, we can begin to speculate where the new CDs might land. Today, we look at North Carolina, which continues to be one of the most important states from a national redistricting perspective.

The Census Bureau’s apportionment report, released on April 26, almost five months after their Jan. 1 deadline, contained the smallest transfer of congressional seats since the World War II era.

Just seven seats are moving from one state to another. As mentioned above, one of the recipients is North Carolina, the state that came the closest to gaining in the last census, missing by just a few thousand people. Today, we speculate as to how a new North Carolina congressional map might unfold.

The 2020 individual state population data has not yet been distributed and is not expected until October, apparently at the earliest. Once the specific state data is made public, the redistricting process can begin, but for now we can only use the latest available data (July 2019) for estimation purposes.

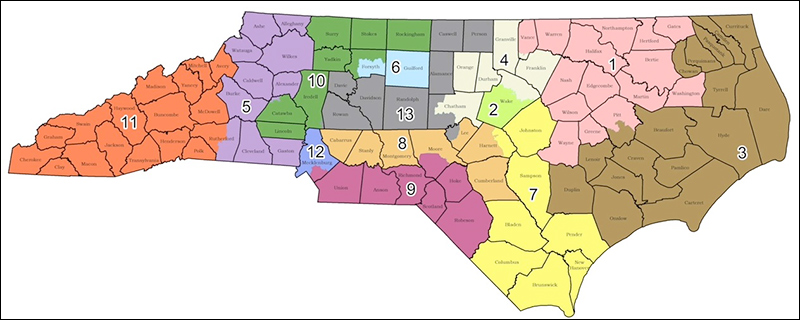
In examining the population numbers for each of the 13 current North Carolina congressional districts, we see that all must shed population to reach the state’s Census Bureau target number of 746,711 individuals, hence, the reason for the Tar Heel State gaining a new district.

In North Carolina, the state legislature has sole jurisdiction over redistricting. The governor, in this case Democrat Roy Cooper, has no veto power over the maps both houses jointly produce. This means the Republicans will control the process since they hold majorities in both the state House and Senate.

No matter what map is drawn, we can count on seeing post-redistricting litigation. In the previous decade, the courts twice altered the original map because of various lawsuits. The final iteration broke 8-5 in favor of the Republicans after the state Supreme Court redrew sections of the state and in effect awarded two previously Republican seats in Raleigh and Greensboro, respectively, to the Democrats.

Continue reading →