Monthly Archives: January 2021

Early House Outlook – Part I

By Jim Ellis

Jan. 20, 2021 — With the presidential Inauguration dominating political attention this week, it is a good time to set the upcoming electoral stage for the US House on a 50-state basis. Today, a first of a four-part series, will begin to look at the 13 western states. During the rest of the week, we will move eastward.


• Alaska – 1 Seat (1R)
Rep. Don Young (R-Ft. Yukon), the Dean of the House, won his 25th term in November with a 54-45 percent victory in a competitive race. With Alaska being an at-large state, reapportionment and redistricting won’t change the political situation. The big question surrounding the 87-year-old congressional veteran is when will he retire?


• Arizona – 9 Seats (5D4R)
The Arizona population growth rate makes them a cinch to gain a 10th District in reapportionment. It is also clear that the new seat will be placed in the Phoenix metropolitan area. Arizona has a redistricting commission comprised of two Democrats, two Republicans, and one Independent. The latter member becomes the chairman. The membership has not yet been chosen.

The state’s marginal nature suggests that we will see a very competitive state once all 10 seats are in place. Currently, there are two districts where the winning House member received 52 percent of the vote or less. This means GOP Rep. David Schweikert (2020 winning percentage: 52.2) and Democratic incumbent Tom O’Halleran (2020 winning percentage: 51.6) will be looking to add more Republicans and Democrats to their seats, respectively.

An open governor’s race (Republican Gov. Doug Ducey ineligible to seek a third term) and what should be a competitive re-election for Sen. Mark Kelly (D) could cause open seats in the House delegation should any of the sitting members attempt to run statewide.


• California – 53 Seats (42D11R)
For the first time in history, the Golden State appears positioned to lose a seat in their US House delegation. With migration exiting the state exceeding those incoming, it appears the California growth rate did not keep up with the specified threshold in order to keep all of their 53 seats. The Los Angeles area is likely to absorb the loss of the seat, but which member will be paired with another is an open question.

California voters adopted an initiative before the 2010 census that established a citizens’ commission to administer redistricting under strict parameters that emphasizes keeping cities and counties whole when possible and irrespective of where any particular incumbent may reside. Therefore, with the mapping power removed from the legislature, it is possible that inside Democratic politics might play a lesser role in the redistricting process.

Continue reading

The Late Luke Letlow’s Widow to Run

By Jim Ellis

Late last week, Julia Letlow (above), widow of late Louisiana Republican Rep.-Elect Luke Letlow, announced that she will run for her late husband’s seat, issuing a statement saying she wants to “ … continue the mission Luke started.” Luke Letlow, 41, passed away Dec. 29, 2020 from a heart attack while battling COVID-19.

Jan. 18, 2021 — On Dec. 5, former congressional chief of staff Luke Letlow (R) won a big election victory, scoring a 62-38 percent Louisiana runoff victory to secure the 5th Congressional District seat and replace his retiring boss, retiring Rep. Ralph Abraham (R-Alto). Just 24 days later and before even being sworn into the House, Letlow, 41, tragically passed away from cardiac arrest after contracting COVID-19.

Late last week, his widow, Julia Letlow, issued a statement saying she wants to “ … continue the mission Luke started — to stand up for our Christian values, to fight for our rural agricultural communities and to deliver real results to move our state forward.” The comments were part of her announcement declaring her own candidacy for the 5th District special election to replace her late husband.

Gov. John Bel Edwards (D) has scheduled both the vacant 2nd District (Rep. Cedric Richmond-D has accepted a position in the Biden Administration and officially resigned from the House last Friday) and the 5th CD special elections for March 20, with a runoff on April 24 should no one receive majority support in the first vote. The candidate filing deadline for both seats is a week from today, Jan. 22.

So far, the LA-5 candidate field has been slow to form largely in anticipation of Julia Letlow becoming a contender. At this point, Democrat Candy Christophe, who missed qualifying for the regular election runoff by just 428 votes, is an announced special election candidate. The only other currently declared contender is frequent GOP candidate Allen Guillory. State Rep. Lance Harris (R-Alexandria), who qualified for the regular runoff election and lost to Luke Letlow, has not yet indicated whether he will enter the special election campaign.

Continue reading

Comparing 2020 & 2016

By Jim Ellis

Jan. 15, 2021 — Now that the presidential numbers are final and certified in all 50 states, we can begin to draw comparisons between the two Trump election years and see the states where movement was most significant.

The 2020 election results show interesting parallels in the race between President Donald Trump and President-Elect Joe Biden and the 2016 race between Trump and Hillary Clinton.

A total of 158,507,118 people are recorded as voting in the 2020 election, an all-time record. In 2016, by comparison, 136,792,535 individuals cast ballots. The current total represents an increase of 15.9 percent. Even those forecasting a turnout of just above 155 million, which seemed outlandish at the time, were low as the 2020 aggregate final vote widely cleared all previous electoral participation records.

As you will see from the following charts, most states performed similarly in 2020 as they did in 2016. In the preponderance of places, both President Trump and President-Elect Joe Biden posted better percentages in 2020, though Trump recorded slightly lower 2020 percentages in 13 states as compared to Biden falling below 2016 Democratic nominee Hillary Clinton in only one (Mississippi).

The change factors are largely due to lesser independent and minor party candidates on the 2020 ballot as opposed to 2016 and an increase in first-time voters.

Nationally, as determined in all 50 states, President Trump’s numbers increased an average of one percentage point per state, while Biden saw a mean average four percent jump over Clinton’s standing.

The first charts depict President Trump’s state totals in alphabetical order. To reiterate, his per state average gain was 1.0 percent. The second chart shows the states in order of the largest gains.

The succeeding Democratic charts illustrate Biden’s increased performance over that of Clinton. Though his national per state victory margin over President Trump was low in comparison to 2016 – changing Arizona, Georgia, Wisconsin and the 2nd District of Nebraska would have changed the national outcome and the aggregate vote margin was only 65,009 – his standing in every state was significantly better than hers. The Biden average per state gain was 4.0 percent.

REPUBLICAN

Alphabetical

STATE 2016 R 2020 R AVG GAIN
Alabama 62.1% 62.3% 0.2%
Alaska 51.3% 52.8% 1.5%
Arizona 48.7% 49.1% 0.4%
Arkansas 60.6% 62.4% 1.8%
California 31.6% 34.3% 2.7%
Colorado 43.2% 41.9% -1.3%
Connecticut 40.9% 39.2% -1.7%
Delaware 41.7% 39.8% -1.9%
Florida 49.0% 51.2% 2.2%
Georgia 50.8% 49.2% -1.6%
Hawaii 29.4% 33.9% 4.5%
Idaho 59.3% 63.8% 4.5%
Illinois 38.8% 40.6% 1.8%
Indiana 56.9% 57.0% 0.1%
Iowa 51.2% 52.8% 1.6%
Kansas 56.6% 56.2% -0.4%
Kentucky 62.5% 62.1% -0.4%
Louisiana 58.1% 58.5% 0.4%
Maine 43.5% 43.6% 0.1%
Maryland 33.9% 32.2% -1.7%
Massachusetts 32.3% 39.1% 6.8%
Michigan 47.6% 47.8% 0.2%
Minnesota 44.9% 45.3% 0.4%
Mississippi 57.9% 41.1% -0.3%
Missouri 56.8% 56.8% 0.0%
Montana 56.2% 56.9% 0.7%
Nebraska 58.7% 58.2% -0.5%
Nevada 45.5% 47.8% 2.3%
New Hampshire 46.5% 45.4% -1.1%
New Jersey 41.4% 41.4% 0.0%
New Mexico 40.0% 43.5% 3.5%
New York 36.1% 37.5% 1.4%
North Carolina 49.8% 49.9% 0.1%
North Dakota 65.1% 31.8% 2.1%
Ohio 51.7% 53.3% 1.6%
Oklahoma 65.3% 65.4% 0.1%
Oregon 40.4% 56.5% 0.7%
Pennsylvania 48.6% 48.8% 0.2%
Rhode Island 38.9% 38.6% -0.3%
South Carolina 54.9% 55.1% 0.2%
South Dakota 61.5% 61.8% 0.3%
Tennessee 60.7% 60.7% 0.0%
Texas 53.2% 52.1% -1.1%
Utah 45.5% 58.1% 12.6%
Vermont 29.8% 30.9% 1.1%
Virginia 44.4% 44.0% -0.4%
Washington 36.8% 38.8% 2.0%
West Virginia 68.6% 68.7% 0.1%
Wisconsin 47.2% 48.8% 1.6%
Wyoming 67.4% 69.5% 2.1%

Performance Increase

STATE 2016 R 2020 R AVG GAIN
Utah 45.5% 58.1% 12.6%
Massachusetts 32.3% 39.1% 6.8%
Hawaii 29.4% 33.9% 4.5%
Idaho 59.3% 63.8% 4.5%
New Mexico 40.0% 43.5% 3.5%
California 31.6% 34.3% 2.7%
Nevada 45.5% 47.8% 2.3%
Florida 49.0% 51.2% 2.2%
North Dakota 65.1% 31.8% 2.1%
Wyoming 67.4% 69.5% 2.1%
Washington 36.8% 38.8% 2.0%
Arkansas 60.6% 62.4% 1.8%
Illinois 38.8% 40.6% 1.8%
Iowa 51.2% 52.8% 1.6%
Ohio 51.7% 53.3% 1.6%
Wisconsin 47.2% 48.8% 1.6%
Alaska 51.3% 52.8% 1.5%
New York 36.1% 37.5% 1.4%
Vermont 29.8% 30.9% 1.1%
Oregon 40.4% 56.5% 0.7%
Montana 56.2% 56.9% 0.7%
Arizona 48.7% 49.1% 0.4%
Louisiana 58.1% 58.5% 0.4%
Minnesota 44.9% 45.3% 0.4%
South Dakota 61.5% 61.8% 0.3%
Alabama 62.1% 62.3% 0.2%
Michigan 47.6% 47.8% 0.2%
Pennsylvania 48.6% 48.8% 0.2%
South Carolina 54.9% 55.1% 0.2%
Indiana 56.9% 57.0% 0.1%
Maine 43.5% 43.6% 0.1%
North Carolina 49.8% 49.9% 0.1%
Oklahoma 65.3% 65.4% 0.1%
West Virginia 68.6% 68.7% 0.1%
Missouri 56.8% 56.8% 0.0%
New Jersey 41.4% 41.4% 0.0%
Tennessee 60.7% 60.7% 0.0%
Mississippi 57.9% 41.1% -0.3%
Rhode Island 38.9% 38.6% -0.3%
Kansas 56.6% 56.2% -0.4%
Kentucky 62.5% 62.1% -0.4%
Virginia 44.4% 44.0% -0.4%
Nebraska 58.7% 58.2% -0.5%
New Hampshire 46.5% 45.4% -1.1%
Texas 53.2% 52.1% -1.1%
Colorado 43.2% 41.9% -1.3%
Georgia 50.8% 49.2% -1.6%
Connecticut 40.9% 39.2% -1.7%
Maryland 33.9% 32.2% -1.7%
Delaware 41.7% 39.8% -1.9%

DEMOCRAT

Alphabetical

STATE 2016 D 2020 D AVG GAIN
Alabama 34.4% 36.6% 2.2%
Alaska 36.5% 42.8% 6.3%
Arizona 45.1% 49.4% 4.3%
Arkansas 33.6% 34.8% 1.2%
California 61.7% 63.5% 1.8%
Colorado 48.2% 55.4% 7.2%
Connecticut 54.6% 59.2% 4.6%
Delaware 53.1% 58.7% 5.6%
Florida 47.8% 47.9% 0.1%
Georgia 45.6% 49.5% 3.9%
Hawaii 61.0% 63.1% 2.1%
Idaho 27.5% 33.1% 5.6%
Illinois 55.8% 57.5% 1.7%
Indiana 37.8% 41.0% 3.2%
Iowa 41.7% 3.2% 3.0%
Kansas 36.0% 41.6% 5.6%
Kentucky 32.7% 36.1% 3.4%
Louisiana 38.4% 39.8% 1.4%
Maine 46.4% 52.5% 6.1%
Maryland 60.3% 65.4% 5.1%
Massachusetts 59.0% 65.1% 6.1%
Michigan 47.3% 50.6% 3.3%
Minnesota 46.4% 52.4% 6.0%
Mississippi 57.6% 40.1% -1.0%
Missouri 38.1% 41.4% 3.3%
Montana 35.7% 40.6% 4.9%
Nebraska 33.7% 39.2% 5.5%
Nevada 47.9% 50.1% 2.2%
New Hampshire 46.8% 52.7% 5.9%
New Jersey 55.5% 57.3% 1.8%
New Mexico 48.3% 54.3% 6.0%
New York 58.4% 60.4% 2.0%
North Carolina 46.2% 48.6% 2.4%
North Dakota 63.0% 27.2% 4.6%
Ohio 43.6% 45.2% 1.6%
Oklahoma 28.9% 32.3% 3.4%
Oregon 39.1% 50.1% 6.4%
Pennsylvania 47.8% 50.0% 2.2%
Rhode Island 54.4% 59.4% 5.0%
South Carolina 40.7% 43.4% 2.7%
South Dakota 31.7% 35.6% 3.9%
Tennessee 34.7% 37.5% 2.8%
Texas 43.2% 46.5% 3.3%
Utah 27.5% 37.7% 10.2%
Vermont 55.7% 65.5% 9.8%
Virginia 49.7% 54.1% 4.4%
Washington 52.5% 58.0% 5.5%
West Virginia 26.5% 29.7% 3.2%
Wisconsin 46.5% 49.4% 2.9%
Wyoming 21.6% 26.4% 4.8%

Performance Increase

STATE 2016 D 2020 D AVG GAIN
Utah 27.5% 37.7% 10.2%
Vermont 55.7% 65.5% 9.8%
Colorado 48.2% 55.4% 7.2%
Oregon 39.1% 50.1% 6.4%
Alaska 36.5% 42.8% 6.3%
Massachusetts 59.0% 65.1% 6.1%
Maine 46.4% 52.5% 6.1%
New Mexico 48.3% 54.3% 6.0%
Minnesota 46.4% 52.4% 6.0%
New Hampshire 46.8% 52.7% 5.9%
Idaho 27.5% 33.1% 5.6%
Kansas 36.0% 41.6% 5.6%
Delaware 53.1% 58.7% 5.6%
Nebraska 33.7% 39.2% 5.5%
Washington 52.5% 58.0% 5.5%
Maryland 60.3% 65.4% 5.1%
Rhode Island 54.4% 59.4% 5.0%
Montana 35.7% 40.6% 4.9%
Wyoming 21.6% 26.4% 4.8%
North Dakota 63.0% 27.2% 4.6%
Connecticut 54.6% 59.2% 4.6%
Virginia 49.7% 54.1% 4.4%
Arizona 45.1% 49.4% 4.3%
Georgia 45.6% 49.5% 3.9%
South Dakota 31.7% 35.6% 3.9%
Oklahoma 28.9% 32.3% 3.4%
Kentucky 32.7% 36.1% 3.4%
Michigan 47.3% 50.6% 3.3%
Texas 43.2% 46.5% 3.3%
Missouri 38.1% 41.4% 3.3%
Indiana 37.8% 41.0% 3.2%
West Virginia 26.5% 29.7% 3.2%
Iowa 41.7% 44.7% 3.0%
Wisconsin 46.5% 49.4% 2.9%
Tennessee 34.7% 37.5% 2.8%
South Carolina 40.7% 43.4% 2.7%
North Carolina 46.2% 48.6% 2.4%
Alabama 34.4% 36.6% 2.2%
Nevada 47.9% 50.1% 2.2%
Pennsylvania 47.8% 50.0% 2.2%
Hawaii 61.0% 63.1% 2.1%
New York 58.4% 60.4% 2.0%
California 61.7% 63.5% 1.8%
New Jersey 55.5% 57.3% 1.8%
Illinois 55.8% 57.5% 1.7%
Ohio 43.6% 45.2% 1.6%
Louisiana 38.4% 39.8% 1.4%
Arkansas 33.6% 34.8% 1.2%
Florida 47.8% 47.9% 0.1%
Mississippi 57.6% 40.1% -1.0%

Early Senate 2022 Previews:
Florida & North Carolina

By Jim Ellis

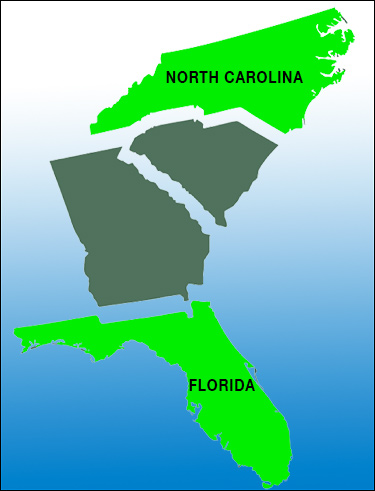
Jan. 14, 2021 — Regardless of how many in-cycle Senate seats – there are 34 in the 2022 election cycle – come into political play, we can count on seeing Florida and North Carolina once again hosting crucial battleground campaigns.

Florida is always consistent in their close vote totals, particularly when remembering the 2000 presidential campaign — and pollsters, while typically forecasting tight finishes, have often missed the outcomes. In fact, the cumulative polling community has predicted close Democratic victories in the last four key statewide elections: two presidential (2016 & 2020), one senatorial (2018), one gubernatorial (2018), and been wrong on each occasion.

Since 2016, inclusive, Florida has hosted eight statewide races with Republicans winning seven. Yet, their average cumulative vote percentage for these eight victorious campaigns was just 50.7 percent, with the high point being 52.0 percent (Sen. Marco Rubio-R, 2016). Democrats recorded the low winning total: 50.04 percent — 6,753 votes from 8,059,155 votes cast; agriculture commissioner, 2018; winner Nikki Fried (D) vs. Matt Caldwell (R). The aggregate average among the statewide contests in these three most recent election years is 50.7 – 47.9 percent in the GOP’s favor.

With this background, Sen. Rubio will presumably seek a third term next year against what will surely be a highly competitive Democratic opponent. At this point, most of the speculation surrounds two Democratic House members, neither of whom has closed the door on either running for the Senate or challenging Gov. Ron DeSantis (R) as he seeks a second term.

Reps. Stephanie Murphy (D-Winter Park) and Val Demings (D-Orlando) are the two most prominently mentioned prospective contenders, and it wouldn’t be surprising to see one run for Senate and the other for governor. It is less likely that we would see a primary developing between the pair in one of the races.

Other names being floated are Rep. Charlie Crist (D-St. Petersburg), who is always mentioned as a potential statewide candidate because he previously served both as attorney general and governor and lost two other statewide campaigns. Other potential contenders are Rep. Ted Deutch (D-Boca Raton) and former Rep. Debbie Mucarsel-Powell (D-Miami). The state’s lone Democratic office holder, Agriculture Commissioner Nikki Fried, is more often associated with running for governor as opposed to the Senate contest.

Continue reading

2022 Senate Outlook

By Jim Ellis

Jan. 13, 2021 — Now that we know Democrats will have a bare 50-50 majority with the vice president breaking the tie, it’s an appropriate time to look ahead to the next election in order to see which party might have the initial advantage.

In an ironic bad news/good news scenario for Republicans, because the party lost the Georgia runoff elections and their majority, the GOP now has further winnable 2022 targets in order to attempt to regain the chamber advantage.

In the new election cycle, a total of 34 Senate seats will be on the ballot. Adding the 2020 final results, we see that 20 Republicans will be defending theirs seats in 2022 as compared with 14 Democrats. The ’22 cycle also includes two reruns from 2020 as both Sens. Mark Kelly (D-AZ) and Raphael Warnock (D-GA), winners of special elections, will again be on the ballot in order to secure respective six-year terms.

Reviewing political voting trends for the past six years in each of these states reveals that now the Democrats actually have more senators seeking re-election (4-3) than Republicans where the four-year major statewide vote average is under 50 percent.

Averaging five data points: the partisan vote percent from the individual senator’s most recent election, the two presidential campaigns (2020 and 2016), the state’s other Senate election, and the most recent gubernatorial vote provides us a partisan mean average vote from the immediate past four-year period.

Doing so finds that Democratic Sens. Mark Kelly (AZ), Maggie Hassan (NH), Catherine Cortez Masto (NV), and Raphael Warnock (GA) see their party’s cumulative four-year average dropping under 50 percent.

Republicans have three such Senate situations. Sens. Pat Toomey (PA), Ron Johnson (WI), and Richard Burr (NC) all represent states where their party’s average vote total drops under the majority mark for the tested period. Already, Sens. Toomey and Burr have announced they will not seek re-election, leaving at least two of the Republicans’ three most vulnerable seats in an open situation.

Continue reading

Definitive Georgia Data

By Jim Ellis

Jan. 12, 2021 — Now that the 159 county returns have been published for the Georgia Senate runoffs and a third more obscure statewide Public Service Commission race, we can see just why the Democrats won the two Senate contests.

The fact that Republican Public Service Commissioner Lauren McDonald was re-elected with the same type of vote margin that saw both Jon Ossoff and Raphael Warnock win allows us to see just where the federal Republican statewide vote was deficient.

As we know, all of these contests were extremely tight. Rev. Warnock had the strongest victory margin among the three, but even his was only 51-49 percent. The final Ossoff victory spread was 50.6 – 49.4 percent, and McDonald, the lone Republican victor, won in the same percentage neighborhood, 50.4 – 49.6 percent.

Obviously, there is little difference among these races and, as we covered previously, the county returns throughout the state show a strong similarity in the Senate totals, thus proving the voters perceived the candidates as being a team. McDonald’s victory, however, does show at least some ticket-splitting tendency was present as enough voters returned to the Republican column to allow him to win re-election.

The drop-off turnout percentage from the general election to these Senate runoffs is the lowest in Georgia political history. The final runoff participation figure recorded a high of 4,474,447 voters, or 90.3 percent of the number voting in the regular Senate elections. Typically, secondary election turnout drops by about one-third. With so much on the line in these runoffs, however, the voters responded in kind.

The key to the election, however, appears to be the percentage turnout in the counties. Democrats maximized their strength to a greater degree, which proved to be the key difference in the Senate runoff outcomes.

Across the board, McDonald ran ahead of the Senate Republicans in virtually every county, but generally only exceeded the other two statewide GOP candidates by less than a percentage point. This slight increased vote spread, however, was enough to turn close losses into a tight victory for the GOP state official.

Continue reading

NY-22: Up 12, Down 14, Now +27

By Jim Ellis

Former New York Rep. Claudia Tenney (R) leads by a whopping
27 votes in her bid to return to the House in the NY-22 race.

Jan. 11, 2021 — The vacant NY-22 electoral count continues to drag on with an end possibly coming soon … at least until the post-election lawsuits begin. The judge still reviewing the initial voting results, Oswego County Supreme Court of the 5th Judicial District of New York Justice Scott DelConte, is personally reviewing all of the contested ballots that at one time totaled approximately 2,100.

Former Rep. Claudia Tenney (R), originally elected in 2016 and who Anthony Brindisi (D-Utica) unseated in 2018, indicated that the latest count, which election officials provided to the candidates, shows her holding a 27-vote districtwide edge. Originally, Tenney led by 12 votes, then, a later tabulation allowed Brindisi to turn the tables to post a 14 vote lead; now Tenney appears to have re-captured the slight advantage, this time by a whopping 27 votes.

The former congresswoman was quoted in a media statement saying, “now that every undisputed ballot has been counted twice, we are still in the lead.” At issue, however, are between 400-500 contested ballots recently delivered to the Justice from Oneida County, an entity that Tenney carried.

Of the district’s eight counties, six of them have finally completed their tabulation after correcting the errors in their ballot challenge procedure per the judge’s instructions. Only small Tioga County, approximately 5,700 votes, had no issues after the initial count. The other seven counties, Justice DelConte concluded, had not complied with New York election law in processing and reporting their challenged ballots; hence, the presiding judge returned the affected ballots to the county offices with orders to correctly process and account for the undetermined votes.

The two remaining outstanding counties in relation to their challenged ballots, Broome and Oneida, are the district’s largest local entities. Together all of Oneida County and the 22nd District portion of Broome, which contains almost the entire latter county’s resident number, account for 60.4 percent of the district’s population. Tenney carried Oneida, with a 50.1 – 48.5 percent vote spread. Brindisi, the 116th Congress incumbent, placed first in Broome County, 56.5 – 40.8 percent. All but the challenged ballots are accounted for, however, and Tenney still maintains the slightest of district leads.

A total of 100,618 votes were cast in Oneida County and 89,775 in Broome. Districtwide, not counting the challenged votes, the district vote total exceeds 311,000 ballots.

Continue reading