Monthly Archives: December 2020

The Losing Regions – Part II

All the best for a great holiday break. The Political Updates will return on Monday, Jan. 4.

A look at how things might play out in key states in the redistricting tug of wars

By Jim Ellis
Dec. 24, 2020 — Continuing our two-part series of examining reapportionment projections for states expected to lose congressional seats, today we look at an additional four states with CDs on the chopping block: Illinois, New York, Ohio, and Pennsylvania.

At this point, it appears a total of ten states are in the losing category. Yesterday, we covered Alabama, California, Michigan, and Minnesota. The remaining two, Rhode Island and West Virginia, are moving to at-large and two district status, respectively, meaning their new maps become obvious.

The new apportionment, originally due at the end of this year but delayed due to COVID, could be released sometime in January.


Illinois

Illinois is a sure loser and one of the few states where the overall population is less (over 158,000 people) according the latest available numbers (July 2019) than registered 10 years ago. Therefore, Illinois is in the rare situation of losing congressional representation not because the population failed to keep pace with the rate of growth, but rather due to the entity actually having fewer people.

This leads to speculation that the state could lose two seats because even in such a scenario the per district population number would be under 800,000 individuals. A two-seat loss would still render the state with a lesser per district total population figure than some of the other states losing one.

All current 18 Illinois CDs need to gain population even under a one-seat loss scenario. Making such calculations we see that the new rudimentary per district population figure would be approximately 745,401 individuals, less than the number projected for most states. Typically, states losing congressional districts feature much higher numbers. This adds to the speculation that the state could drop a second CD.

If the loss is only one, as the current projection formula suggests, the southern part of the state would appear to take the hit. This means that Republicans, while holding only five of the state’s current 18 districts, would likely lose a seat. Aside from Rep. Cheri Bustos’ (D-Moline) 17th District anchored in the Quad Cities region, which has the largest population number to gain, over 79,000 people, the remaining seven of the top eight districts needing a population increase come from the Downstate region.

The figures suggest that combining the five central and southern districts of Reps. Mike Bost (R-Murphysboro), Rodney Davis (R-Taylorville), incoming freshman Mary Miller (R), Adam Kinzinger (R-Channahon), and Darin LaHood (R-Peoria) into four districts would be the most likely scenario unless the Bustos district is collapsed. Considering that the Democrats control the redistricting process, it is probable that the former scenario would be the one adopted.


New York

Like Illinois, New York, while having slightly more people than they did in 2010 (just over 75,000 more according to July 2019 estimated figures), could be on the cusp of losing two seats. Of their current 27 districts, 24 must gain population. Only the seats of Reps. Hakeem Jeffries (D-Brooklyn), Gregory Meeks (D-Queens), and Adriano Espaillat (D-Bronx) are in the position of shedding residents. All others need a population influx even to reach the approximated 748,213 figure that appears be present at this point for a 26-District model.

As in Illinois, a two-seat loss would still keep the per district number at well under 800,000, much less than other states that are projected to lose congressional representation.

Also as in Illinois, the non-urban area looks to need the largest population gain (meaning Upstate, in this case), would contain the area most prone to lose a seat. This means, also as in Illinois, that the party in a small minority, the Republicans, is most likely the one on the chopping block.

Continue reading

The Losing Regions – Part I

By Jim Ellis

Dec. 23, 2020 — With the Census Bureau readying the national apportionment formula to present to the Clerk of the House at some point next month, it is a reasonable time to again look at the states projected to lose congressional districts and begin to determine where a dragging population could cost a region its current representation.

Today, we look at four states projected to lose a district: Alabama, California, Michigan, and Minnesota. Tomorrow, we will examine Illinois, Ohio, Pennsylvania, and New York. Rhode Island and West Virginia are also going to lose seats but because they are two- and three-district states, the new redistricting map becomes obvious, particularly in the former’s case.


Alabama

The Alabama population suggests that it is too small to keep its seventh congressional district, but such makes the remaining six districts very large, likely well over population figures of 800,000 residents apiece. It is an ironic problem for the states losing districts in that the remaining CDs actually become much larger. If Alabama is on the losing end in final reapportionment, the scenario of dropping a district and making the remaining seats much larger will certainly come to pass.

As with all redistricting, those in a corner of a state, i.e., either bordered by another state, body of water, or country are in the best shape because their districts can only expand or contract one or two ways. In Alabama, the 1st and 5th CDs, those of incoming Rep. Jerry Carl (R-Mobile) and Mo Brooks (R-Huntsville) are in the most favorable geographic positions.

The district appearing to lose the most population is Rep. Terri Sewell’s (D-Birmingham) 7th CD, but this is a protected Civil Rights district meaning it must be protected. The seat could need to gain almost 150,000 people according to rudimentary calculations, and the most likely place for the increase comes from Montgomery County at the expense of the 2nd District and possibly the 3rd.

The 2nd District, even when bordered by states on two sides, appears the most vulnerable to collapse. Needing to likely gain over 140,000 individuals before almost certainly losing population to the current 7th District, the collapsing of the 2nd and 3rd Districts into one seat appears to be a potential outcome. This would place incoming freshman Rep. Barry Moore (R-Enterprise) and veteran Congressman Mike Rogers (R-Anniston) in the same district.


California

For the first time in history, California looks to lose congressional representation. In the last census, the state remained constant for the first time. In every previous census apportionment, the Golden State had gained representation. In the 1980 census, for example, California gained seven new congressional districts. Now, it appears they will reduce representation from 53 to 52 seats, but still be the most populous state by a wide stretch.

The region not keeping up with the rate of growth appears to occur in the southern California expanse from Bakersfield through Los Angeles County and portions of Riverside, Orange, and San Bernardino Counties. Such a region covers 18 congressional districts, 16 of which will need to gain population under a rudimentary calculation suggesting that each of the state’s 52 CDs will require approximately 760,000 residents. Of the 18 districts, Democrats represent 15 and Republicans’ three.

Only two of these 18 districts, those of Reps. Brad Sherman (D-Sherman Oaks) and Norma Torres (D-Pomona), are either at or slightly over the approximated population goal.

Continue reading

Outstanding Races: A Look-In

(Jon Ossoff – “Selma”)

By Jim Ellis

Dec. 22, 2020 — The Georgia Senate runoff campaigns continue to see brisk pre-election voting participation and huge amounts of money being spent, while one of the candidates appears to be fundamentally changing his message strategy. In the two contested House races, the NY-22 result remains undecided, while questions are being raised around the IA-2 situation with regard to seating the state certified winner on Jan. 3.

The Georgia races, heading into Christmas week, feature political surveys finding both campaigns, those of Sen. David Perdue (R) against Jon Ossoff (D) and Sen. Kelly Loeffler (R) paired with Rev. Raphael Warnock (D) in their special election battle, falling within the polling margin of error.

The Target Smart statistical organization reveals that Democrats are slightly leading Republicans in pre-election ballots returned (47.0 – 46.7 percent, respectively within the universe of returned ballots), a difference between the two parties of just 4,025 ballots. Over 1.329 million votes have been received through the end of last week, which is only 241,088 under the number of early and mail votes recorded in the 2020 regular election.

During the regular election, the Democrats led the early and mail voting participation with 748,741 ballots (47.7 percent of the total return) compared to the GOP’s total of 719,515 (45.8 percent). The unaffiliated sector returned 102,635 ballots in the regular election. So far in the runoff cycle, 82,756 unaffiliated individuals have either voted early or mailed their ballots.

During the week, Democratic candidate Jon Ossoff changed his media strategy. Prior to this period, the Ossoff campaign had been concentrating on COVID as their key issue driver, but now appear to be concerned about African American voter turnout. With the pre-election numbers being slightly down for Democrats as described above, the change in Ossoff strategy suggests that the campaign strategists do not feel the black vote numbers are where they need to be to clinch a victory on Jan. 5.

Continue reading

NM-1: New Vacancy

By Jim Ellis

Dec. 21, 2020 — Late last week, President-Elect Joe Biden announced that he is nominating New Mexico US Rep. Deb Haaland (D-Albuquerque) to be Interior Secretary. Upon confirmation, Rep. Haaland will resign her seat in the House, which will become the body’s third vacancy.

Biden has already chosen Reps. Cedric Richmond (D-LA) and Marcia Fudge (D-OH) to run the White House Office of Public Engagement and become Secretary of the Department of Housing and Urban Development, respectively.

Special elections will be held in all three districts and scheduled once the member officially resigns to accept his or her new position. Democrats will be prohibitive favorites in Louisiana and Ohio, but it’s possible the New Mexico seat could become competitive.

Haaland was first elected to what was an open district in 2018 when then-Rep. Michelle Lujan Grisham (D) risked the 1st District House seat to wage an ultimately successful campaign for Governor. Grisham was first elected to the House in 2012 in an open seat campaign. She succeeded then-Rep. Martin Heinrich (D), who won a Senate seat in the same election.

Prior to Heinrich’s initial House win in 2008, the 1st District congressional seat, anchored in Albuquerque, had been in Republican hands for 40 consecutive years in the person of Reps. Manuel Lujan, Steve Schiff, and Heather Wilson, consecutively. Though the district has significantly changed politically, it has largely kept its same basic geographic context during the entire aforementioned stretch. Prior to the 1968 election, New Mexico’s representatives were chosen in at-large elections.

Once Haaland, one of the first Native American females to be elected to the House, resigns, Gov. Grisham will schedule a special election. Under New Mexico procedure, the political parties will caucus to choose their nominees, so there will be no primary election. Therefore, it is probable to see a contested convention process for both parties, particularly for the Democrats since their eventual nominee will begin the special election campaign in the favorite’s position.

Continue reading

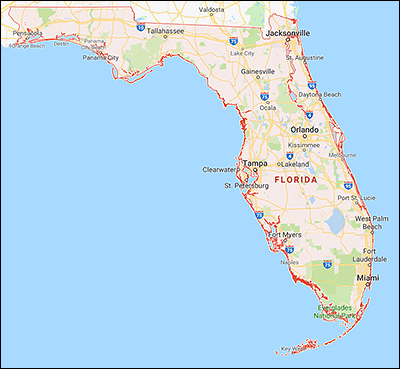
Florida Data

By Jim Ellis

Dec. 18, 2020 — Continuing with our project this week of analyzing statewide data now that official final election results are being published from around the country, today we look at the Sunshine State of Florida, another key redistricting state.

Though having only three-quarters of Texas’ population, the Florida presidential turnout came within only a few hundred to equaling that of the Lone Star State (FL: 11,067,366; TX: 11,315,056).

On the statewide tally, President Trump carried Florida with a 51.2 – 47.5 percent margin over former vice president Joe Biden. The result represents a net 2.2 percentage increase for the president when compared with his 2016 statewide total, while Biden’s performance registered a decline of 0.3 percent from Hillary Clinton’s Sunshine State aggregate vote.

The House performance detected in California and Texas, showing that the average victorious congressional candidate performed better within their particular district than President Trump, was not nearly as pronounced in Florida.

On average, Texas US House Republican candidates ran 2.8 percentage points better than Trump, and the average California GOP House candidate ran 4.2 points ahead of the president’s statewide percentage. In Florida, however, the number was virtually equal to the president’s, with the average House Republican contender running just 0.2 percent above Trump’s statewide total.

Because two of the Republican incumbents, Reps. Neal Dunn (R-Panama City) and Mario Diaz-Balart (R-Miami/Hialeah), ran either without Democratic opposition (Dunn) or totally unopposed (Diaz-Balart) the Florida Secretary of State does not record votes in such a district. Therefore, for purposes of this exercise, a projected result of 65-35 percent for the two congressional districts was added as an estimated total. This percentage spread was extrapolated when comparing the performance of Republican and Democratic congressional candidates in similar Florida districts.

To review, in California, Democratic House incumbent performance fell below their 2018 recorded vote in 33 of 44 districts, while results improved for four of the six Republican incumbents on the ballot. In Texas, vote percentages for 11 of the 16 Republican incumbents seeking re-election improved from 2018, while the Democratic incumbent performance index declined for all 13 who ran for a succeeding term.

Continue reading

Texas Data

By Jim Ellis

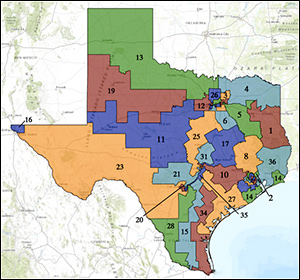
Texas US House Districts

Dec. 17, 2020 — Yesterday, we analyzed the California official 2020 Statement of the Vote and today we turn out attention to voting statistics from the Lone Star State of Texas, a particularly interesting domain for the coming redistricting process. Estimates project that Texas will gain three congressional districts from reapportionment, which should become official at some point in January.

Despite predictions of a “blue wave” hitting Texas and putting the state in play for Joe Biden, Republicans once again swept the competitive races. Though President Trump’s margin did decline from 2016, his 52-46 percent margin was still more than comfortable, especially when considering he was simultaneously losing the nationwide vote.

As was the case in California, down-ballot GOP candidates, as a rule, performed better than President Trump. Sen. John Cornyn (R) was re-elected, and the GOP won 23 congressional races in the state, accounting for almost 11 percent of their party’s national total.

Sen. Cornyn topped 53 percent of the vote in recording a nine-point win over his Democratic opponent, retired Army helicopter pilot M.J. Hegar. In the 23 victorious Republican House races, the winning GOP candidate outpaced President Trump in 19 districts most of which were competitive at least to a degree.

Compared with the Democratic improvement in elections two years ago, the GOP rebounded in 2020. A total of 16 Republican incumbents sought re-election, and 11 of those improved their vote percentages from 2018. Additionally, all five of those falling below their previous benchmark did so by less than one percentage point.

For the Democrats, all 13 of their House incumbents saw a downgrade in their voter support from 2018. Rep. Henry Cuellar (D-Laredo), who fought off a tough Democratic primary challenge in early March, saw the biggest drop for any Texas House incumbent, falling from 84.4 percent in 2018 to a 58.3 percent win in November. The more serious drop, however, was for Rep. Vicente Gonzalez (D-McAllen) who won re-election to a third term from his South Texas district with just 50.5 percent of the vote against an opponent who spent only $404,000. Gonzalez’s victory percentage slipped from 59.7 percent in 2018.

The TX-15 district is largely a Mexican border seat that starts just east San Antonio in the Seguin area and travels south all the way through the city of McAllen in Hidalgo County. The latter entity hosts three-quarters of the 15th District’s population. Republicans, including President Trump, improved their standing throughout the Mexican border area in the 2020 election, which was a principal reason that Democratic gains in the Dallas, Houston, Austin, and San Antonio metropolitan areas were somewhat offset.

Statewide turnout was up a strong 23.7 percent when compared to 2016, enabling the state to exceed 11 million voters (11,315,056) for the first time. The Texas population grew 3.9 percent during that same time interval.

Continue reading

Biden Elected; Calif. Data Published

By Jim Ellis

Dec. 16, 2020 — The Electoral College met in the various state capitols Monday, as scheduled, and the electors cast their ballots in the exact correlation with the state election data. Since the Electoral College increased to 538 members in time for the 1964 presidential election, we’ve seen faithless electors — those who vote for a candidate other than whom the state voters supported — in seven presidential elections.

No faithless elector appeared in Monday’s vote, however, meaning the final official count is Joe Biden, 306; President Trump, 232; the exact numbers produced on election night. The Supreme Court issued a ruling earlier in the year codifying that the states have the right to bind their electors. A total of 29 states and the District of Columbia had previously taken such action, so the court’s July 6, 2020 ruling in the Chiafalo v. Washington State case meant that these 30 entities’ votes would be forced to directly follow their respective electorates.

The remaining 21 states do not bind their electors, so those electors were still free to vote for someone outside of the Nov. 3 election totals. Monday, however, none did.

The action now means that Joe Biden is officially the President-Elect. The Electoral College will now report their results to the Congress on Jan. 6, 2021, where the votes will be counted and recorded. At that point, Biden will be officially elected and ready to take the oath of office as the 46th president of the United States on Jan. 20, 2021.

The California delegation is the group that put Biden over the top, allowing him to first clinch a majority vote in the Electoral College. Also coming from the Golden State is the official Statement of the Vote from the 2020 election, and it contains some interesting numbers to analyze.

Biden received more than 11.1 million votes in California, or 63.5 percent of the total ballots cast. President Trump obtained just over 6 million votes, good for 34.3 percent. Though the latter percentage is small, it is almost three full points beyond than his 2016 showing within the state.

Continue reading