Monthly Archives: February 2022

North Carolina Map Rejected

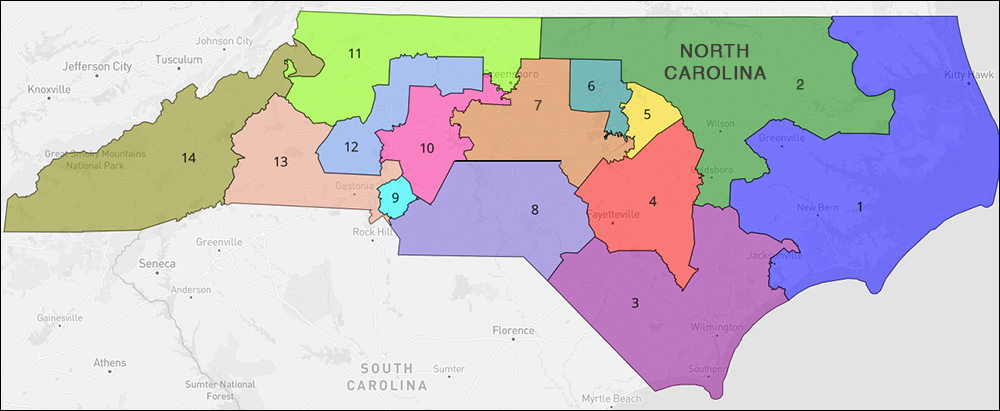
Rejected 2022 North Carolina Congressional Redistricting map (click on map above or here to go to an interactive map at DavesRedistricting.com)

By Jim Ellis

Feb. 8, 2022 — In what has almost been a decade-long game of gerrymander ping pong, the state Supreme Court on Friday rejected the new North Carolina congressional and state legislative maps, thus repeating their actions from the two previous times the panel’s majority disqualified a Republican legislature’s map.

The vote was 4-3, with all four Democrats voting in favor of declaring the map a partisan gerrymander, consistent with their past action, while the three Republicans voted to uphold the plans.

We are again looking at a relatively quick re-draw situation because the twice-postponed North Carolina primary is now scheduled for June 7. If an agreement cannot be reached, it is possible the candidate filing deadline and statewide primary are again postponed.

The high court’s move was expected, but this is a serious setback to Republicans from a national perspective since North Carolina appears to be the only state where the party can gain multiple seats through redistricting.

It is likely that the inter-party pairing of Reps. Virginia Foxx (R-Banner Elk) and Kathy Manning (D-Greensboro) will be re-drawn when a new congressional version is passed. The Greensboro area has been the major focal point of this and the previous maps, with the partisan Republican legislature and partisan Democratic court continuing to battle over a map that will eventually become the state’s 2022 political playing field.

As drawn, the legislature’s map — under North Carolina law and procedure, the governor, in this case Democrat Roy Cooper, has no veto power over redistricting — would have returned either 10 Republicans and 4 Democrats or possibly has high as 11 Republicans and 3 Democrats. Under the current draw, the Republican advantage is 8-5.

North Carolina gained one seat under national reapportionment, and the last iteration of the state Supreme Court map, ordered before the 2020 election, resulted in the Republicans losing two seats, one in Raleigh and the other in the Greensboro area.

Continue reading

Redistricting Update Notes: Florida, Michigan, Pennsylvania

Florida Redistricting:

Gov. DeSantis Queries High Court: Attempting to solve the disagreement between Gov. Ron DeSantis (R) and some leadership members from the state legislature, the state’s chief executive has asked the Florida state Supreme Court for an advisory opinion about the legality of dividing the majority minority 5th District that stretches from Tallahassee to Jacksonville. A brand new Michigan state Supreme Court ruling (see below) that affirmed the state’s redistricting commission move to divide their minority seats in Detroit could provide some precedent for the Florida high court.

Michigan Redistricting:

State Supreme Court Rejects Dem Legislators’ Claim: The Michigan state Supreme Court, on a 4-3 vote, rejected the redistricting challenge of a group of current and past Detroit area African American state legislators late Thursday. The plaintiffs were arguing that the Michigan Independent Citizens Redistricting Commission members illegally divided many of the minority Voting Rights districts, but a majority of the justices disagreed. Therefore, the Commission-adopted congressional and legislative maps will stand pending further litigation in federal court should the plaintiffs, or others, launch additional legal action.

Pennsylvania Redistricting:

State Supreme Court Assumes Jurisdiction: The Pennsylvania state Supreme Court, known as one of the most politically partisan judicial panels in the country, announced last week that it is claiming jurisdiction of the redistricting case now before Republican judge Patricia McCullough of the Commonwealth Court. At first, this appeared a partisan Democratic move, but the high court then installed Judge McCullough as the special master with the responsibility of drawing the new congressional and state legislative maps.

Pennsylvania lost a seat in reapportionment, so political observers are closely watching this process. The current Pennsylvania delegation features a 9R-9D split, but this was after the state Supreme Court changed the map before the 2018 election, thus allowing the Democrats to gain three seats. The maps are in court because Democratic Gov. Tom Wolf vetoed the Republican legislature’s plans.

House Money: Year-End 2021

By Jim Ellis

Feb. 7, 2022 — The Federal Elections Commission finally posted the year-end 2021 campaign financial disclosure numbers, and the Daily Kos Elections site statistical team has already compiled the totals for both the House and Senate.

We concentrate on the House financial picture since all of the competitive Senate races will feature each party’s nominee having more than enough funding with which to communicate their message to the targeted voter segments.

Our first table illustrates the House leadership’s fundraising totals, as they are a key focal point of national funding for their candidates. With a close House partisan division, and a large number of competitive races slated for November, the political dollars will be flowing abundantly.

The text shows the member’s name (party identified by color: red = GOP; blue = DEM ), the amount (in thousands) raised in the 4th quarter of 2021, the cash-on-hand reported in the member’s campaign account on Dec. 31, 2021, and how much the income each campaign committee reports for the entire 2022 election cycle.

Leadership

NAME ST-DIST 4TH QTR CASH-ON-HAND CYCLE-TO-DATE
McCARTHY, KEVIN CA-20 $3,758       $8,350       $14,890
PELOSI, NANCY CA-11 $2,844       $5,420       $15,941
SCALISE, STEVE LA-1 $2,652       $6,524       $12,888
STEFANIK, ELISE NY-21 $1,078       $3,140       $5,050
CLYBURN, JIM SC-6 $523       $2,452       $1,761
HOYER, STENY MD-5 $443       $1,164       $1,916

$1 Million in Qtr 4 – Non-Leadership Incumbents

NAME ST-DIST 4TH QTR CASH-ON-HAND CYCLE-TO-DATE
SCHIFF, ADAM CA-30 $2,806       $16,766       $9,997
PORTER, KATIE CA-47 $2,515       $16,125       $10,231
CRENSHAW, DAN TX-2 $2,115       $4,516       $10,794
CHENEY, LIZ WY-AL $2,043       $4,715       $7,221
JORDAN, JIM OH-4 $1,448       $8,532       $6,891
OCASIO-CORTEZ, AL. NY-14 $1,422       $6,236       $9,879
KIM, YOUNG CA-40 $1,216       $2,564       $4,009
GREENE, MARJORIE T. GA-14 $1,185       $3,512       $8,690
JACKSON, RONNY TX-13 $1,126       $1,079       $2,450
KRISHNAMOORTHI, RAJA IL-8 $1,108       $11,551       $4,447
GOTTHEIMER, JOSH NJ-5 $1,041       $12,012       $3,950
SCHRIER, KIM WA-8 $1,002       $4,022       $3,026

$1 Million in Qtr 4 – Open Seats & Challengers

NAME ST-DIST 4TH QTR CASH-ON-HAND CYCLE-TO-DATE
FLOWERS, MARCUS GA-14 $1,321       $1,544       $4,603
LUTTRELL, MARCUS TX-8 $1,186       $1,618       $1,923
HUNT, WESLEY TX-38 $1,004       $1,555       $2,029

Most Cash-on-Hand – $3 Million +

NAME ST-DIST 4TH QTR CASH-ON-HAND CYCLE-TO-DATE
SCHIFF, ADAM CA-30 $2,806       $16,766       $9,997
PORTER, KATIE CA-47 $2,515       $16,125       $10,231
GOTTHEIMER, JOSH NJ-5 $1,041       $12,012       $3,950
JORDAN, JIM OH-4 $1,448       $8,532       $6,891
McCARTHY, KEVIN CA-20 $3,758       $8,350       $14,890
SCALISE, STEVE LA-1 $2,652       $6,524       $12,888
HARDER, JOSH CA-9 $867       $6,316       $3,660
OCASIO-CORTEZ, AL. NY-14 $1,422       $6,236       $9,879
DELGADO, ANTONIO NY-19 $708       $5,481       $3,219
DOGGETT, LLOYD TX-37 $166       $5,476       $582
PELOSI, NANCY CA-11 $2,844       $5,420       $15,941
SHERRILL, MIKIE NJ-11 $771       $5,078       $2,911
THANEDAR, SHRI MI-13 $5       $5,000       $5
CHENEY, LIZ WY-AL $2,043       $4,715       $7,221
HOULAHAN, CHRISSY PA-6 $464       $4,545       $2,005
CRENSHAW, DAN TX-2 $2,115       $4,516       $10,794
SLOTKIN, ELISSA MI-7 $957       $4,509       $3,894
KHANNA, RO CA-17 $310       $4,330       $3,556
FOSTER, BILL IL-11 $383       $4,264       $917
LaHOOD, DARIN IL-17 $550       $4,244       $2,080
SCHRIER, KIM WA-8 $1,002       $4,022       $3,026
SHERMAN, BRAD CA-32 $244       $3,956       $1,083
PALLONE, FRANK NJ-6 $362       $3,836       $1,296
BROWNLEY, JULIA CA-26 $223       $3,658       $930
SCHRADER, KURT OR-5 $427       $3,563       $1,408
GREENE, MARJORIE T. GA-14 $1,185       $3,512       $8,690
CONNOLLY, GERRY VA-11 $199       $3,497       $1,079
KILMER, DEREK WA-6 $258       $3,464       $1,147
KIM, ANDY NJ-3 $761       $3,300       $3,369
CHU, JUDY CA-28 $214       $3,177       $656
STEFANIK, ELISE NY-21 $1,078       $3,140       $5,050
JEFFRIES, HAKEEM NY-8 $787       $3,119       $3,046
SPANBERGER, ABIGAIL VA-7 $776       $3,036       $3,066

Cortez Masto Rebounds in New Poll

By Jim Ellis

Nevada Sen. Catherine Cortez Masto (D)

Feb. 4, 2022 — Nevada Sen. Catherine Cortez Masto (D), who trailed in the most recent published statewide poll (Trafalgar Group; Nov. 24-29; 1,034 likely Nevada general election voters; Adam Laxalt (R) 44 percent, Cortez Masto (D) 41 percent) has rebounded to regain the lead according to a new OH Predictive Insights survey, but warning signs persist for the first-term incumbent.

The OHPI poll commissioned for the Nevada Independent news site (Jan. 19-26; 755 likely Nevada registered voters, online) finds Sen. Cortez Masto topping former state Attorney General Laxalt (R) in a general election ballot test by a 44-35 percent margin. While the spread is relatively strong in her favor, posting a 44 percent support number is low for any incumbent.

For example, the same poll tested Gov. Steve Sisolak, a Democrat, and found his preference figure reaching 52 percent if Clark County Sheriff Joe Lombardo were his Republican opponent, and 54 percent if former US Sen. Dean Heller were to become the Republican gubernatorial nominee. Because OHPI forced preference answers, meaning no recorded undecided responses for the governor’s ballot test, the Sisolak support numbers are high. It is unlikely, however, that a traditional preference question would find him dropping to the senator’s current support level.

The OHPI pollster isolated Sen. Cortez Masto’s most significant problem as her being tied to President Biden’s low approval ratings. According to this study, the president only posts a 41:53 percent favorable to unfavorable job approval index, and 33 percent, which is the poll’s top issue response, said that the economy and jobs are most important to them. Isolating Biden’s score on his handling of the economy, the president’s disapproval rose to 55 percent, darkening the political climate for the senator even further.

Laxalt’s low support number (35 percent) is likely due to him recording only a 76 percent preference factor among Republicans. This is likely due to the fact that challenger Sam Brown, a businessman and disabled Afghan War veteran, is becoming a significant contender for the Republican nomination.

Though the GOP sample segment is low in the OHPI survey – only 230 respondents and well below the 300 that becomes statistically significant in a state the size of Nevada – we still see only 37 percent of the Republican base supporting Laxalt while 14 percent names Brown as their preferred candidate. This means that 49 percent of those Republicans polled say they are undecided about whom to support in the GOP Senate primary. Despite having a short sample, the results suggest that Laxalt still has work to do in securing the nomination.

Another changing element that could affect this race, but in a heretofore unknown way, are the party registration changes occurring throughout 2021. Comparing the partisan breakdown in the state from January of 2021 through December of last year, both the Democrats and Republicans lost patrons. Democratic registration dropped 2.9 percent, while Republicans were down 2.5 percent. This meant that those registering Non-Partisan and “Other” were up substantially.

Continue reading

Michigan House Action Wave

Michigan Congressional Redistricting Map. (Click on image to go to FiveThirtyEight.com to see interactive map.)

By Jim Ellis

Feb. 3, 2022 — Though the Michigan congressional lines are in litigation and filing time is still more than two months away in preparation for the state’s August 2nd primary election, Tuesday was a busy day on the Wolverine State’s US House front.

First, in the paired Republican incumbent 4th District where Rep. Bill Huizenga (R-Holland) is seeking re-election and appears ready to face fellow Rep. Fred Upton (R-St. Joseph), a third candidate announced that he would not abandon his own Republican campaign despite seeing an unfavorable district draw.

State Rep. Steve Carra (R-Portage) said that he intends to remain in the new 4th Congressional District race despite potentially having to face two incumbents and not having any of his current state House District lying in the new 4th. His legislative district will now be fully contained in Rep. Tim Walberg’s (R-Tipton) new 5th CD that stretches the width of Michigan along the state’s southern border. Carra earned former President Trump’s endorsement in his pre-redistricting bid against Rep. Upton.

When queried about the difficulty of the paired nomination race for a non-incumbent such as himself, Carra said, “It doesn’t matter whether there’s one or two status quo Republicans in the race.”

For his part, Rep. Upton is not yet committing to run for a 19th term, saying he wants to further study the new district and see whether the courts disqualify the current map. A group of current and former Democratic state legislators have filed suit against the Michigan Independent Citizens Redistricting Commission claiming the members violated the Voting Rights Act with their draw of the congressional and state legislative districts in Detroit and Wayne County.

The 4th District will be one of the most interesting primary campaigns in the state and possibly the nation if Huizenga and Upton ultimately face each other. With Carra coming to the race with the Trump endorsement and potentially testing just how much the ex-President’s support actually means, he becomes a wild card entry.

Another incumbent who did not fare well in the redistricting process is freshman Rep. Peter Meijer (R-Grand Rapids). His 3rd District moves from an R+9 to a D+3 seat according to the FiveThirtyEight statistical site. Dave’s Redistricting App scores the CD at 50.1 percent Democratic and 46.5 percent Republican. President Biden would have carried the new 3rd, 53-45 percent. Therefore, Rep. Meijer, along with potential primary problems because he, too, voted in favor of the Trump impeachment, has a difficult political road ahead.

Continue reading

Redistricting Boom Hits

New York 2022 redistricting map. (Click on map to go to FiveThirtyEight.com’s interactive map to see breakdown of each Congressional district.)


By Jim Ellis

Feb. 2, 2022 — The redistricting boom that political observers were awaiting has hit. The New York legislature unveiled their new congressional map, and akin to what the Democratic leadership passed in Illinois, the Empire State plan decimates the Republicans just as expected.

As we will remember, New York lost one congressional seat in national reapportionment (by just 89 people statewide) thereby reducing the delegation size to 26 seats. The current 27-district map yields 19 Democrats and 8 Republicans. The new map is projected to reduce the GOP contingent to just four seats.

Starting on Long Island and knowing that Rep. Lee Zeldin (R-Shirley) is leaving his 1st District to run for governor and understanding that the four districts covering the island are a cumulative 148,780 people short of the per congressional district quota of 776,971 residents, means major differences for these seats.

The map drawers brought the 1st District further west, the only thing they could do to capture the number of needed new people, and as a result were able to turn this R+10 district according to the FiveThirtyEight statistical site into a Biden +10.8 percent seat according to an analysis in the Washington Post.

Note that because the New York presidential election was so lopsided, largely because the Trump campaign never tried to become competitive, using just the 2020 presidential numbers to project voter history is likely slanted even more distinctly toward the Democrats. Once more analyses come into the public domain, we will be better able to pinpoint the partisan trend in each new district.

The 1st District draw makes Rep. Andrew Garbarino’s (R-Sayville) 2nd much redder. His CD, designed to now follow the open 1st District’s borderline to the south, would register as a Trump +14.3 percent district as compared to the previous R+8 calculation from FiveThirtyEight.

The plan would then improve both Rep. Tom Suozzi’s (D-Glen Cove) open 3rd District (Biden +14.2 percent) as it moves further into Queens, and Rep. Kathleen Rice’s (D-Garden City) 4th CD. The latter district would record a 12.1 percent Biden performance, up from the 538 total of D+9.

All of the New York City Democrats would again retain safe seats. The big change would come in the Staten Island-Brooklyn district of freshman Rep. Nicole Malliotakis (R-Staten Island). Her current 11th CD voted for Trump in 2020 by a 10.5 percent margin (538: R+13). Under this plan, the Washington Post rates the newly configured 11th for Biden with a +9.9 percentage point spread. Former Rep. Max Rose (D), who Malliotakis unseated in 2020, is back for a re-match. If this map becomes law, as expected, the 11th District playing field will be greatly altered.

The upstate region also significantly changes. Freshman Rep. Mondaire Jones’ (D-Westchester County) district becomes slightly more competitive, from a D+17 to a Biden +13.3 percent. Rep. Sean Patrick Maloney (D-Cold Spring) would go from representing a district that 538 rated as even between the two parties to a Biden +8.3 percent edge. Rep. Antonio Delgado (D-Rhinebeck) would see his 19th CD strengthen from R+4 to Biden +10.0 percent.

Continue reading

A Curiously Conflicting Georgia Poll

By Jim Ellis

“The negative driver for this [Georgia poll] appears to be President Biden.”

Feb. 1, 2022 — The Atlanta Journal-Constitution (AJC) released one of their regular Georgia statewide polls that the School of Public and International Affairs from the University of Georgia administers (Jan. 13-24; 872 registered Georgia voters, live interview) and the results reflect an electorate with some conflicting views.

While President Biden’s job approval ratio has taken a steep dive since the news entity’s May 2021 survey was published, and the right track/wrong track question is heavily lopsided toward the negative, the current statewide office holders and even the state legislature land in the positive approval realm. Yet, in the accompanying ballot test numbers, the tested Democratic officials are trailing despite brandishing the relatively positive approval ratios.

President Biden now records a combined 34:61 percent favorable to unfavorable index (13 percent strongly approve; 21 percent somewhat approve; 11 percent somewhat disapprove; 50 percent strongly disapprove), which is a huge net reduction of 32 percentage points from his combined 51:46 percent score in May (28 percent strongly approve; 23 percent somewhat approve; 9 percent somewhat disapprove; 37 percent strongly disapprove).

In the new January poll, the respondents believe, in a very poor 17:71 percent ratio, that the country is on the wrong track. They also feel Georgia is headed in the wrong direction, but with less intensity, 34:48 percent negative. The May AJC poll, with a shorter questionnaire, did not ask similar track questions.

The sense of the nation figures in the January study, however, also seem inconsistent with how these same respondents rate their elected federal officials. Sens. Raphael Warnock (D) and Jon Ossoff (D) record 44:35 percent and 43:35 percent positive ratios, respectively. This tells us that the sampling universe members don’t hold their senators particularly responsible for the country being on the perceived wrong track.

In another inconsistency, the senator who is on the 2022 ballot, Rev. Warnock, actually trails his prospective general election opponent, former Georgia and NFL football star Herschel Walker (R), despite the positive job approval sentiment. In this AJC poll, Walker holds a 47-44 percent lead. This latter finding is also consistent with a recent Quinnipiac University study (Jan. 19-24; 1,702 registered Georgia voters, live interview) that gave the challenger an edge, but with a smaller 49-48 percent split.

The governor’s numbers show a similar inconsistency. In Gov. Brian Kemp’s (R) case, while the state is viewed as headed in the wrong direction, the chief executive does not appear to be shouldering an excessive amount of blame. His job approval lies in the positive realm at 49:43 percent favorable to unfavorable. Paired with his likely general election opponent, 2018 gubernatorial nominee and former state House Minority Leader Stacey Abrams (D), Kemp leads 48-41 percent.

Continue reading