Tag Archives: Redfield & Wilton Strategies

Ohio Data: Below the Surface

By Jim Ellis

Sept. 10, 2021 — The London-based Redfield & Wilton Strategies international survey research firm tested electorates in several American states at the end of August, and today we look at their Ohio results. With a major open Senate campaign and a Republican governor seeking re-election in 2022, the Buckeye State is once again a national political focal point for the coming political year.

Ohio Rep. Tim Ryan announces his candidacy for the 2020 Presidential Election on the TV talk show, “The View.”

The Redfield & Wilton poll (Aug. 20-24; 1,200 likely Ohio voters) finds the Republican Senate candidates performing adequately opposite US Rep. Tim Ryan (D-Warren/Youngstown), who, at this early stage, has become the Democrats’ consensus statewide Senate contender.

Former state treasurer and 2012 US Senate candidate Josh Mandel (R) holds a 51-47 percent ballot test lead over Rep. Ryan within the sample segment who are self-identified as likely 2022 general election voters. Author J.D. Vance (R) largely falls into a dead heat with Ryan, trailing 37-36 percent, as does former Ohio Republican Party chair Jane Timken who places within two points of the congressman, 38-36 percent.

In the governor’s race, incumbent Republican Mike DeWine, who former Rep. Jim Renacci is challenging in the GOP primary from the ideological right, looks to be in strong shape against potential Democratic opponents. If Dayton Mayor Nan Whaley were the Democratic gubernatorial nominee, Gov. DeWine would post a 46-27 percent advantage. Should Cincinnati Mayor John Cranley become the Democratic nominee, he would trail the governor by a slightly larger 47-25 percent spread.

Generally, the Ohio polling pattern leans Democratic in the early going and then closes in the Republican candidates’ favor, while consistently understating GOP strength.

In the 2020 presidential election, Ohio polls in July of the election year were returning Joe Biden leads of 4-8 percentage points before former President Trump would rebound to score a mean average 1.0 percent polling lead close to election day, and then win the state going away with an eight-point margin, 53-45 percent. In 2016, the pattern was similar. In the July-September period, Hillary Clinton held leads of between 4 and 7 percentage points only to see the average favor Trump by a 2.2 percent spread. He would win the state 51-43 percent.

The same pattern occurred for Sen. Rob Portman (R) in 2016 and was present to a degree against Sen. Sherrod Brown (D) in 2018. In June through September of that year, certain polls found former Gov. Ted Strickland (D) leading incumbent Portman with a 3-6 point edge. As the race closed, Sen. Portman established an average 18-point lead and won 58-37 percent.

Even in a Democratic victory, the polling trend favoring Democrats early and then closing for the GOP toward election day was again present. During June-September of 2018, Sen. Brown held leads between 13-17 points. Going into the election, his polling average had slipped to 11 points, and he only won with a 6.4 percent margin.

Keeping this pattern in mind and then looking at the underlying Biden job approval numbers in the R&W poll suggests that even today, the GOP candidates are poised for a stronger finish than the current results yield. Overall, the Redfield & Wilton figures point to a 40:46 percent favorable to unfavorable presidential approval ratio for Biden, which isn’t particularly bad particularly in a state that the subject did not win. The underlying numbers, however, point to a much greater negative.

Continue reading

Conflicting Electorate Clues

By Jim Ellis

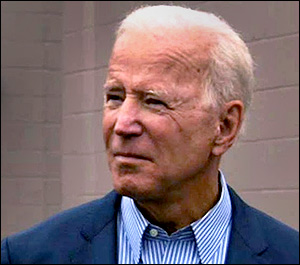
President Joe Biden lingers at the bottom of presidential rankings after his first 100 days.

May 24, 2021 — Data points are routinely being published covering the electorate’s status, leading to various conflicting conclusions. This allows both Democrats and Republicans to promote favorable prediction trends for the 2022 elections.

Presidential job approval is often used as a key prediction benchmark. The Gallup Research organization pioneered presidential job approval tracking, beginning in the 1950s with President Dwight D. Eisenhower, and the tradition continues today.

During that approximate 70-year period, the average performance for a newly elected president in his first 100 days in office is 61 percent favorable. Only those presidents who were elected are included in the Gallup survey. This means that presidents Lyndon B. Johnson, who ascended to the office when John F. Kennedy was assassinated, and Gerald R. Ford, who became president when Richard M. Nixon resigned, are not included.

If you remove, however, the highest rated national leader, President Kennedy (81 percent approval) and the lowest, President Donald J. Trump (41 percent), the adjusted average climbs to 63 percent.

In his first 100 days, Gallup rates President Biden with a 57 percent approval figure, thereby placing him as only the 9th most popular of the 11 newly elected modern era chief executives.

The top three rated presidents in their first 100 days are Kennedy (81 percent), Eisenhower (74 percent), and Ronald Reagan (67 percent). The three lowest are presidents Trump (41 percent), Bill Clinton (55 percent), and Biden (57 percent).

Other surveys rate Biden’s performance somewhat lower, however. In the month of May, eight additional pollsters have tested the president’s job performance and found his favorable score in a tight range, from 51-54 percent with his disapproval percentage spanning from 35 to 48.

The generic polling question is one where a survey respondent is asked whether they would vote for the Republican or Democratic House of Representatives candidate. Right now, we’re seeing the generic numbers span the ideological spectrum, which tells us the great partisan divide is still very much alive. The left-leaning pollsters are seeing big leads for Democrats, while the more conservative-oriented pollsters find the responses very tight.

Continue reading

Is Biden Under-Performing?

By Jim Ellis

Former vice president and current 2020 presidential candidate, Joe Biden (D)

May 28, 2020 — Currently, former vice president Joe Biden is leading in virtually every battleground state poll that has been released into the public domain; but do the survey numbers tell the whole story? Other available data, that derived from actual votes being cast, suggest there may be cracks forming in his political armor.

In terms of battleground states, a new Arizona poll was released Tuesday, in what could become the most important must-win domain for the Trump campaign. There, the Phoenix-based HighGround Public Affairs consulting firm publicized their latest Arizona statewide poll (May 18-22; 400 likely Arizona general election voters), and the ballot test projects Biden holding a tighter 47.0 – 45.3 percent edge over President Trump.

Though Biden leads, the trend is a clear improvement for Trump since the OH Predictive Insights poll (May 9-11; 600 likely Arizona voters) became public during mid-May and posted the former vice president to a 50-43 percent advantage. Redfield & Wilton Strategies followed with their survey release (May 10-14; 946 likely Arizona voters) that yielded a closer 45-41 percent Biden lead.

Tuesday’s HighGround survey also published some interesting secondary questions. In answering whether the respondents felt President Trump job performance was excellent, very good, or OK, the combined positive calculated to 49.5 percent. Among those believing the president’s job performance is poor or failing, the negative totaled to 49.0 percent.

Accordingly, 29.3 percent of the Arizona respondent sample believes President Trump is to blame for the spread of the coronavirus, while 20.3 percent pin the responsibility on China. All other responses: the people, federal government, Democrats, or other unnamed sources each registered less than 10 percentage points. A total of 25.3 percent say they either don’t know or believe no single source is to blame.

Over the Memorial Day weekend, the state of Hawaii hosted its Democratic presidential primary. The unique format is interesting in that there were two votes the participants cast: the first included choosing among all of the names who originally qualified for the Hawaii presidential nomination ballot. The second isolated only Biden and Sen. Bernie Sanders (I-VT). Just under 35,000 people cast mail votes in the stand-alone presidential primary.

Continue reading