Tag Archives: Mitt Romney

Unexpected Voter Turnout Patterns

We wish you the best for the happiest of Thanksgiving holidays. The PRIsm Political Updates will return Monday, Nov. 26.

The official state participation and candidate preference statistics are being released throughout the nation, and many of the numbers are quite surprising. While turnout was down nationally, it was up in most of the battleground states and, despite Pres. Barack Obama’s victory, it may be erroneous to assume that the turnout pattern completely favored him.

While it is clear the president obviously benefited from the voting preferences of the aggregate group of people who cast ballots during the election process, it is interesting to note that he was only able to return 91.5 percent of the total vote he received in 2008. In contrast, losing national Republican nominee Mitt Romney retained 99.4 percent of John McCain’s 2008 vote. Obviously Romney needed to do better than to simply equal McCain’s vote, but it is significant that Obama’s share of the vote declined by almost a full 10 percent from what he obtained four years ago, especially when understanding that the Obama campaign clearly had the superior grassroots organization.

Nationally, and rather astonishingly from what was widely forecast before the election, overall voter turnout was down six million votes from the number cast in 2008, or a fall-off of 4.7 percent. It appears that virtually all of the drop-off came from the Obama coalition, as the president’s vote receded by almost that same amount as did the national turnout (voter participation reduction: 6,148,768 individuals; Obama drop: 5,917,631 votes).

The four core states also recorded interesting turnout patterns. Of the quartet of places that Romney needed to convert if he were to unseat the president, it was North Carolina — the only state in this group that he did carry — that had the highest participation rate increase from 2008. North Carolina voter turnout was up 4.5 percent in comparison to their aggregate number of voters from four years ago. Virginia and Florida, two of the three core states that remained with the president, also saw increased participation. Virginia was up 3.5 percent; Florida 1.0 percent.

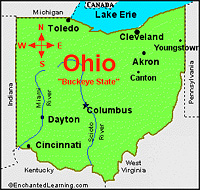
Ohio, often believed to be the most important state in the presidential contest because it was viewed to be a national bellwether, surprisingly recorded a lower turnout this year than during the previous Obama victory campaign. Ohio turnout was down a rather substantial 5.9 percent, or greater than 336,000 participants from 2008.

Of those seven states commonly viewed to be in the secondary target group — at least one of which Romney would have had to have carried to be successful, more if he failed to carry all of the core states — four saw increased participation, and three declined. The states producing a greater number of voters were in the Midwest (Wisconsin, up 2.4 percent; Iowa, increasing 1.9 percent) and West (fast-growing Nevada adding 4.5 percent; Colorado, up 3.1 percent).

The three eastern and Mid-Atlantic states all recorded a smaller voter participation rate. Pennsylvania, always considered a swing state and a place that attracts a great deal of campaign attention, saw its voter turnout rate fall 6.1 percent; Michigan, the only state in the Union that actually lost population in the preceding decade, dropped 5.7 percent; and New Hampshire returned almost the same number of voters, coming in just 5,091 ballots under their 2008 total.

It appears the biggest voter drop-off occurred in some of the nation’s largest states, those that are most Democratic and among the president’s strongest places. His home state of Illinois, for example, saw more than 431,000, or 7.8 percent, fewer people vote this year than when compared to their favorite son’s first election in 2008. New York had the largest drop-off, a stunning 19.8 percent below its participation level of four years ago. California, the nation’s largest state, was off 12.5 percent. But, lower turnout rates were not confined only to the large Democratic states. Texas, the biggest and most loyal Republican entity, also saw a reduction in turnout. Over 112,000 fewer voters went to the polls in 2012 when compared to 2008.

More analysis will be completed when additional data is available, but these statewide turnout numbers may have produced more questions about the nation’s voting patterns than answers.
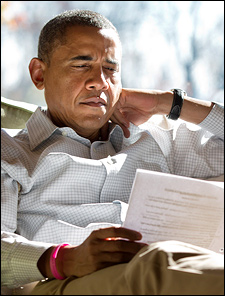
Virginia Numbers Tell the Tale

(Official White House Photo by Pete Souza)

The Virginia State Board of Elections just released their 2012 results segmented by congressional district, the first state to do so, and the data give us further insight as to why Pres. Barack Obama again carried the Old Dominion. The state was long known to be one of the determining voting entities of the campaign, therefore the refined and newly released information carries national significance.

Statewide, voter turnout was reported to be 75.9 percent of the registered voters recorded as “active” by the Virginia state elections officials. The highest turnout district was that of House Majority Leader Eric Cantor (R-VA-7), as 82.8 percent of the central Virginia active registered voters participated. The lowest turnout rate was found in Rep. Gerry Connolly’s (D) northern Virginia 11th District where only 68.9 percent of active registered voters went to the polls.

At the congressional level, eight of the 11 districts were drawn to favor Republicans. The map performed as designed, because the eight GOP congressional incumbents all won re-election. In the presidential race, however, Obama obviously outperformed his Democratic congressional running mates, but only carried one more district than they. Obama won Districts 2 (Rep. Scott Rigell-R), 3 (Rep. Bobby Scott-D), 8 (Rep. Jim Moran-D), and 11 (Rep. Connolly). Therefore, despite GOP nominee Mitt Romney carrying seven of 11 congressional districts, he still lost the state. Obama’s official margin over Romney was 149,279 votes, meaning at least this many people are ballot switchers or did not vote in their individual congressional race.

Perhaps the most extraordinary finding is how Romney’s performance compared to the Republican congressional candidates. In all but one CD, the Republican congressional candidate recorded more votes than Romney. The lone exception was the western-most 9th District, commonly called “The Fighting Ninth” or the “coal district.” Here, Romney scored 11,456 votes more than Rep. Morgan Griffith (R), even though the latter was winning a convincing 61.3 percent re-election victory.

But it is the Northern Virginia seats where the most eye-opening results occurred. Despite not running competitive campaigns against Reps. Moran and Connolly, Republican candidates J. Patrick Murray and Chris Perkins in Districts 8 and 11, respectively, actually recorded more votes than did Romney. Murray secured 4,933 more votes than the Republican presidential nominee; Perkins garnered 9,441 tallies greater than Romney’s total. But none can come close to the results found in the new 10th District, where veteran Rep. Frank Wolf (R) out-polled Romney by 38,362 votes.

To put this in perspective, even though Murray received only 30.6 percent support against Moran and Perkins 35.5 percent in opposing Connolly, more people voted for them in these two districts than for Romney.

The other determining region was the Tidewater area, where the former Massachusetts governor failed to carry Rep. Rigell’s District 2 (he scored 48.6 percent there) and ran 12,466 votes behind the congressman, who won his first re-election with 53.7 percent. The other marginal Republican Tidewater CD, Rep. Randy Forbes’ (R) 4th District, showed an even greater difference between Romney and the congressional candidate. Here, Forbes ran 18,287 votes ahead of the man at the top of his party’s ticket. Romney eked out a 50.1 percent win over Obama, while Forbes racked up 56.9 percent in clinching his sixth re-election.

Comparing the presidential and congressional races to the Senate campaign between eventual winner Tim Kaine (D), the state’s former governor, and ex-Sen. George Allen (R), it was the Democratic candidate who carried the majority of the congressional seats — six to the Republican’s five. In addition to the seats that went for Obama (Districts 2, 3, 8 and 11), Kaine also carried Republican districts 4 and 10.

In more Virginia news, Quinnipiac University (Nov. 8-12; 1,469 registered Virginia voters) just released the first public survey of next year’s gubernatorial contest. Not surprisingly, the results determined that popular Sen. Mark Warner (D) would easily defeat both known Republican aspirants, Lt. Gov. Bill Bolling and Attorney General Ken Cuccinelli. Warner’s margins are 53-33 percent over Bolling and a similar 56-33 percent when paired with Cuccinelli. There has been speculation that Warner might enter the state’s 2013 governor’s race, thus giving him a better platform from which to launch a presidential campaign in 2016.

Former Democratic National Committee chairman and 2009 gubernatorial candidate Terry McAuliffe was likewise tested against the two Republicans. These match-ups suggest a much closer statewide race. Against Bolling, McAuliffe jumps out to a slight 38-36 percent lead; the margin becomes 41-37 percent when Cuccinelli is inserted as the hypothetical Republican nominee.

Obama and Senate Ds; House Rs

The question as to which of the two party’s polling methodology and turnout model projection was correct was answered in the this morning’s early hours, as the Democratic projections proved to be spot on.

As they predicted, Pres. Barack Obama was re-elected with what could be as many as 332 Electoral Votes, should he carry still-outstanding Florida. The absentee ballots will determine the winner at a later date, but the outcome from what was formerly challenger Mitt Romney’s most important state is now irrelevant in determining the victor.

The race was as close as forecast, with the president taking the popular vote, preliminarily, by some 2.5 million ballots, an approximate margin of 51.1 percent. The individual core states of Florida, North Carolina, Virginia and Ohio were just as close as the national popular vote but, in the end, the president captured at least two of the four places, and possibly three, that Romney was virtually forced to win.

As has been the case since 2006, inclusive, the Senate races ended in a run. And, as in two of the three immediately previous elections, it was the Democrats who scored big. Despite having to defend 23 of 33 Senate seats, the Democrats will fare no worse than breaking even and quite possibly will see a net gain of two seats. Both Montana and North Dakota remain outstanding at this writing, going to political overtime. In the Big Sky Country, it will be the final counting plus the absentee ballots in both states that will determine the winner. But, Democratic Sen. Jon Tester (MT) and former Attorney General Heidi Heitkamp (ND) lead in both races. If the two hold their leads, the final Senate margin will increase to 55D-45R.

At the beginning of the election cycle, considering Republicans needed to win only 14 of 33 Senate races to capture the majority, such an outcome was only remotely considered. Again, the polling proved to be spot on, and did correctly forecast the Democratic surge at the end for all of the competitive races. Only in Arizona (senator-elect Jeff Flake) and Nevada (Sen. Dean Heller) did the Republican candidates prevail.

In the House, Republicans held their majority but Democrats cut into their advantage. With 12 races remaining uncalled, the Republicans have 232 seats compared to the Democrats’ 191. Since the LA-3 contest ended in two Republican candidates headed to a post-election run-off (Dec. 1 – Reps. Charles Boustany and Jeff Landry), the minimum GOP number for the ensuing Congress will be 233. Of the remaining 11 races, they have the pre-absentee ballot counting edge in only two, so if trends hold constant in all results, the party division will be 235R-200D, or a gain of seven seats for the Democrats.

Most of the outstanding elections are in Arizona and California, and they are razor-thin. The margins are as follows:

  • AZ-1: The result here could mark the return of former Rep. Ann Kirkpatrick (D). She has a 6,716 vote margin over former state Sen. Jonathan Paton (R). About 1% of the total vote remains to be counted before absentee ballot tabulation.
  • AZ-2: In a real surprise, Republican challenger Martha McSally has a very slight 386 vote lead over just-elected Rep. Ron Barber (D) in the Tucson region seat. This is the former district of ex-Rep. Gabrielle Giffords (D). Barber, her former staff member, won a similar district in a June special election. Absentee ballots will be the determining factor here.
  • AZ-9: The absentees will help decide this marginal race, too, as former state Sen. Kyrsten Sinema (D) has a small 2,101 vote edge over Paradise Valley Mayor Vernon Parker (R). This race never veered from a small Sinema lead all night.
  • CA-7: Challenger Ami Bera (D) leads Rep. Dan Lungren (R) by just 184 votes, but thousands of absentee ballots remain.
  • CA-26: Democrat Julia Brownley has a 7,099 vote lead over state Sen. Tony Strickland (R), but again the thousands of absentee ballots will make the final call.
  • CA-36: Challenger Raul Ruiz (D) leads Rep. Mary Bono Mack (R) by 3,451 votes, but only 57.4% of total universe of ballots has been counted. There could be as many as 50,000 ballots left here and in CA-7.
  • CA-52: Absentees will also determine the winner in this San Diego district, as challenger Scott Peters (D) leads Rep. Brian Bilbray (R) by just 685 votes.
  • FL-18: Freshman Rep. Allen West (R) finds himself trailing newcomer Patrick Murphy by 2,456 votes, and absentees will also determine the final victor here, too.
  • LA-3: As mentioned above, the 3rd District race will move to a Dec. 1 run-off election between two Republican incumbents. Rep. Charles Boustany has a 45-30% lead over Rep. Jeff Landry heading to a secondary election that is sure to produce a Republican winner.
  • MI-1: Freshman Rep. Dan Benishek (R) is holding a small 2,297 vote advantage over former state Rep. Gary McDowell (D). The absentee ballots could still change the outcome here, as well.
  • NC-7: Democratic Rep. Mike McIntyre is holding a mere 378 vote lead over state Sen. David Rouzer (R), with thousands of absentee ballots remaining.

Analysis of all these and other results and trends coming later today.

Election Day Rundown

Eleven national polls were reported at this closing of the election period, and they’re all over the map. Six give Pres. Barack Obama a national lead of one to four points, three have the race tied and two show Republican Mitt Romney with a slight one point edge. The campaign, still, on Election Day, is too close to call.

All of the earliest-closing states are key for tonight. Polls begin to close at 6 pm in parts of Indiana and Kentucky and 7 pm EST in the remaining regions of these two states and Vermont, South Carolina, Georgia, and all-important Virginia and Florida (except for the western panhandle, which is in the Central time zone; normally, results are withheld from release until the entire state closes). Excluding Vermont, Romney needs to sweep these states, and most particularly Florida. Should he fall in the Sunshine State, then the predicted late night election result will conclude early, because he simply cannot compensate elsewhere for failing to capture its 29 Electoral Votes.

With Ohio, which appears to be the decider of this election, continuing to teeter, Virginia becomes that much more important for Romney. Though he could theoretically win the Electoral College vote without either the Buckeye State or Old Dominion, it is clear that he must carry one of the two. Practically, looking at the final trends in other swing states such as Nevada and Iowa, it is becoming apparent that both Ohio and Virginia need to go Romney in order for him to win.

Thirty minutes after the first wave of states close at 7 pm, North Carolina, West Virginia and Ohio itself will conclude their election period. Romney must carry both NC and WV, and then we concentrate on the Ohio trend for the rest of the evening.

At 8 pm Eastern, about half of the states will be closed, including everything in the central and eastern portion of the country with the exception of swing state Iowa, which doesn’t close until 10 pm EST.

In the 9 pm EST belt, look at the critical secondary swing states of Wisconsin and Colorado. At that point, with the exception of Nevada, which now looks to be trending definitively toward the president, the election-determining states will be closed and their early trends will have already been released in most of the country.

It is likely to be a long night, and though it is generally a bad sign for an incumbent to have the polling numbers of Obama — that is, still not having a clear winning spread on the morning of Election Day and the late trends favoring the challenger — the race is far from over.

Democrats appear poised to keep control of the Senate. In the early reporting zone, look to the Indiana race between Rep. Joe Donnelly (D-IN-2) and state Treasurer Richard Mourdock. The Republicans need to hold the open seat (Sen. Richard Lugar was defeated in the Republican primary), but trends are clearly favoring a Donnelly upset. Without Indiana, it will be extremely difficult for the GOP to have a realistic chance of capturing the four Democratic seats they need to wrest control away from their opposition. Republican losses in Maine and Massachusetts in the 8 pm hour will seal their fate.

In the House, watch two seats as the polls close at 7 pm. The southwestern IN-8 district of freshman Rep. Larry Bucshon is marginally in play. Bucshon winning early will be a good sign for Republicans. Rep. Donnelly’s open 2nd CD should go Republican in the person of former state Rep. Jackie Walorski. A Democratic victory in either would likely spell doom to the GOP hopes of gaining congressional seats, but still won’t put the majority in danger.

Kentucky, also a 7 pm closer as noted above, is the fastest vote counter of all the states. Here, watch the 6th District re-match campaign between Rep. Ben Chandler (D) and challenger Andy Barr (R). This was the second-closest election in 2010 and figures to be competitive again. If their quick count doesn’t show a Chandler victory, then the Democrats could be in for a longer night than expected in the House races.

Just a thought: you might want to print out this post and keep it handy so you can check off items above as the evening moves on.

It’s been quite a ride throughout the 2012 election cycle and, even as voting is now well underway, the final result is not yet clear.

Predicting the Presidential Outcome

At long last the election is finally here, but we still can’t predict the presidential outcome with any confidence. Recognizing that there have been many conflicting national polling factors present for the past several weeks, now at the end of the campaign it appears that all of the major pollsters are projecting just about the same final national popular vote result – a virtual tie.

Seven polls were released on Thursday through Saturday, and four of them (Ipsos/Reuters, Rasmussen Reports, UPI/C-Voter, and Zogby for the Washington Times) produced a high-40s deadlock between Pres. Barack Obama and Republican challenger Mitt Romney. Two (Purple Strategies and Public Policy Polling) forecast a one-point lead for Obama. One, the ABC/Washington Post poll, showed Romney with that same single-point advantage. Simply put, the national election doesn’t get any closer.

Good news actually exists for both candidates in these final surveys. First, bringing the candidates back into a tie is positive for the president, who had been starting to drop behind. On the other hand, and an argument in Romney’s favor, an incumbent tied going into the election is rarely a good sign, because challengers typically under-poll to at least a small degree.

On the state front, Ohio still appears to be the deciding factor. There are some favorable indications that Romney will win close victories in North Carolina and Florida, which are his top priority conversion states. He also is trending upward in Virginia, but the all-important Buckeye State remains a mystery. The president has a slight edge in several polls, but not in others.

Looking at the secondary states, though Nevada and possibly Iowa look to remain in the president’s column, Romney is getting strong positive signs from Colorado. Should he be successful in taking Virginia and Ohio, Colorado would clinch a victory for the challenger.

Polling

There has been a great deal of analyses done about the myriad of polls conducted over the past months, and the conflicting nature between the ones that have projected the 2012 vote using a turnout model based upon 2008 voting patterns. Many have said that using such base data explains the polling discrepancies because the 2012 electorate is much different than that of four years ago. Therefore, using the 2008 model may skew too heavily Democratic.

Mike Barbera, a Washington lobbyist and guest columnist for our reports, has studied this situation, and offers the following perspective: Given all available evidence, the idea that the 2012 electorate will be as Democratic as 2008 is implausible – and the notion that it will be even more Democratic is to be completely rejected.

The 2008 election cycle featured the following:

  • A highly motivated Democratic base, enthused by the historic candidacy of Barack Obama and still seething with animus toward George W. Bush
  • A dispirited Republican base (although the Palin vice presidential selection remedied this to a certain degree)
  • A historically-unpopular outgoing Republican president
  • A huge funding disparity, which allowed the Obama campaign to dramatically outspend the McCain forces on the airwaves and in the get-out-the-vote (GOTV) efforts
  • An economic meltdown a month before Election Day

That is a recipe for what a great Democratic year looks like – and indeed the Democrats in 2008 had a great year. They elected a president as well as super-majorities in both the House and Senate.

To put it mildly, 2012 looks nothing like 2008. By any measure, Republican enthusiasm is much higher than in 2008. Obama’s favorability ratings are significantly lower than they were in 2008. His job approval ratings are dismal. Romney and his GOP allies are at financial parity with the Obama campaign and the Democrats – so the Republican GOTV efforts are vastly improved from the threadbare McCain operation of 2008. Romney is doing very well among independents – John McCain lost them by a substantial margin.

Early Voting

States are reporting the number of ballots already returned through the various early voting processes. While all of the partisan numbers, i.e. the ballots returned from registered Democrats, Republicans, and unaffiliated voters, are better for Romney and the Republicans than the ratios from four years ago, it is unclear if they are a precursor to a Romney victory performance.

The Romney camp compares the current early voting trends to that of 2008 GOP nominee John McCain and illustrates what they believe is their candidate’s improvement over his showing. While there seems no doubt that the already returned ballots will yield better results for the Republican, as the Obama campaign points out, Romney must exceed the president’s vote total, not just that of McCain, and in every state but Colorado (that releases early voting partisan registration data) more Democratic ballots have been returned than Republican. All totaled, almost 30 million people have already voted in this election.

The Senate

Democratic trends in the statewide contests are better than for Republicans. It now appears likely that the Democrats will retain control of the Senate and do so with about the same level of strength they currently maintain: a seat up or down from the current 53D-47R margin.

The House

While the Senate races appear to be trending Democratic, the Republicans are pulling away in the House. The GOP majority is secure, and their original majority margin, based upon 242 seats, could even increase by as many as three or four seats when analyzing the final individual race trends.

Conclusion

This election is very close, and could be following one of two election models. The first would be that of 1980, where Ronald Reagan was running close to incumbent President Jimmy Carter, only to catch a wave at the very end and go onto a major landslide victory. The second potential precursor is the 2004 election, where a relatively unpopular incumbent President, George W. Bush, won a close victory that basically came down to the state of Ohio becoming the deciding factor. Determining the actual result is now merely hours away.

Little Change in Two Years

Less than one week before Election Day 2012, we know little more about the projected outcome than we did when the campaigns began in earnest almost two years ago. At that time there was uncertainty about the presidential election. A feeling persisted that Pres. Barack Obama could certainly win re-election, but enough vulnerability existed that a strong challenger could deny him a second term.

With majority Democrats having to protect 23 of the 33 in-cycle contests, control of the Senate appeared up for grabs. With the 2010 state legislative elections swinging hard toward the Republicans, thus giving them clear control of the redistricting process, it became a foregone conclusion that the House GOP majority would be sustained in a post-reapportionment election year with newly drawn congressional district boundaries.

Two years later and six days away from the people’s decision, we still have no counter-arguments to any of these observations.

According to all of the latest national polls, the presidential race is a virtual tie. Seven national pollsters released popular vote surveys yesterday and the biggest spread among the group was Rasmussen Reports producing a two-point lead for Republican Mitt Romney. Five of the polls were showing one-point margins either way, and one, Public Policy Polling for the Service Employees International Union (SEIU), showed a 49-49 percent tie. It simply doesn’t get any closer.

Turning to the states, we find equally close numbers though the Romney position has improved in many key electoral vote havens. Think of the model that stated the Republican needed to convert Indiana, the 2nd Congressional District of Nebraska (because the state awards it electoral votes individually for the candidate carrying each congressional district), Florida, North Carolina, Virginia, Ohio and one other Obama state larger than Vermont or Delaware. Today, Romney looks solid in Indiana and NE-2, and good in Florida and North Carolina, while improving to even footing in Virginia. But this standing, while much better than his Republican predecessor’s of four years ago, does not clinch victory.

The next tier becomes determining. The Romney trends in Ohio are improving, and at least one pollster, Rasmussen Reports, actually has the challenger forging ahead in the Buckeye State by the slimmest of margins. All other survey research firms show either a tie or a slight Obama lead. Trends seem to be moving Romney’s way in Colorado. Iowa, Wisconsin and New Hampshire are all still very much in play, and are virtually deadlocked. Obama has been recently drawing stronger numbers in Nevada. Movement could still occur in Pennsylvania, Michigan, Minnesota and possibly even Oregon, but it is likely that these states are only flirting with the Republicans and will return to the Democratic fold on Election Day.

Though there are still ways for Romney to win nationally without carrying Ohio, assuming the rest of our analysis rings true, he likely won’t unseat the president without winning what is becoming the deciding state. It is very likely that the way Ohio eventually votes will determine who remains or becomes president. Amazingly, the election is still simply too close to call.

The Senate remains just as tight, though Democrats are in good position to hold at least a bare majority. There are still 14 Senate races projected to be within the margin of error, so anything can still happen. The outcome of the presidential race will likely help decide all of these critically important, and virtually dead even contests.

There are ominous signs on the near horizon for the president, however. As an incumbent, going into an election tied rarely leads to victory. The Obama campaign confirms Romney’s momentum by consistently promoting a negative message. Additionally, aggregate estimates from all of the early voting states suggest that the Democrats are more than 20 percent behind their 2008 pace of returning the ballots to the election officials. They are still responding in greater numbers than Republicans, but the Democratic margin is certainly down. And, finally, we are all basing our predictions on polls showing a zero to two-point difference when their own error factor is 2.5 to 3.5 percent.

It’s clear this election will be very close and it’s possible we could be headed to political overtime, meaning absentee ballot counting could again make the difference, just as it did in 2000.

Gallup Shows Likely Voters Skew to Romney

Source: Gallup

The Gallup organization released their likely voter model on Oct. 26, which, along with Rasmussen Reports, has consistently shown much better numbers for Mitt Romney than other national polls. It is important to note that Gallup and Rasmussen are the only two pollsters that have tracked the presidential race every day for the entire election cycle. Both have found consistently similar results, too. The myriad of other pollsters have conducted benchmark or brush fire polls, meaning they are surveying the national electorate for just a short period in time and producing a snapshot of the voters’ intentions rather than a trend.

Right now, all of the polling suggests a Romney lead in the national popular vote among those considering themselves likely to vote, with Pres. Barack Obama doing better in the critical states and among the registered voter universe. The likely voter numbers are producing a very unique and inverted situation because similar situations in the past have always shown the Democratic candidate leading the popular vote, while the Republican fared better in the states.

According to the Gallup analysis, the electorate looks virtually the same as it did in 2008, but the voting intensity model is quite different. There is either no, or only a one-point, difference in the demographic categories when comparing today with four years ago, and as much as a four-point increase among non-white voters when overlaying 2012 data against what was found within the 2004 electorate that re-elected George W. Bush.

Gallup maintains that their likely voter model, culled from a series of seven screening questions (see below), has correctly predicted the final trend in the past two elections. Their 2004 pre-election projection suggested a two-point Bush popular vote win, which is what happened. In 2008, the final data correctly predicted Obama’s win, but over-shot his performance. The Gallup data predicted an 11-point Obama spread; in actuality the final count was +7 points over Republican John McCain.

Today’s model shows virtually no demographic difference between 2008 and 2012, but a major swing in terms of self-identified party registration. Four years ago, 39 percent of the likely voter sample considered themselves Democrats to only 29 percent for Republicans.

According to Gallup’s latest data, the 2012 partisan self-identified likely voter ratio breaks Republican 36-35 percent, a swing of 11 net points for the GOP (+7R; -4D) in comparison to 2008. When the “lean Democrats” and “lean Republicans” are added, the model expands to 49-46 percent Republican (based upon tracking data collected over the Oct. 1-24 period). This is highly significant in detecting electoral intensity. If correct, the 2012 vote will be very different from 2008 and much more Republican. Today, Gallup shows a 50-46 percent spread in Romney’s favor among likely voters. Rasmussen finds Romney’s lead to be a similar 49-47 percent.

But, it all comes down to which of the pollsters’ likely voter model is correct. Gallup has actually posted the seven questions they ask to determine voter participation intent, as reported on Gallup.com.

They are:

  1. Thought given to election (quite a lot, some)
  2. Know where people in neighborhood go to vote (yes)
  3. Voted in election precinct before (yes)
  4. How often vote (always, nearly always)
  5. Plan to vote in 2012 election (yes)
  6. Likelihood of voting on a 10-point scale (7-10)
  7. Voted in last presidential election (yes)

Answers are graded on a scale of 1-7 and the results categorized accordingly. The latest numbers from their registered voter pool gives Obama a 48-47 percent edge, but the likely voter group goes significantly for Romney, as previously mentioned, 50-46 percent.

It’s going to be a very close and interesting election. Next week will determine which of all predictions are correct, but Gallup has already provided the most information to help us understand their support methodology.

Obama Will Not Be Fired

On Wednesday, Republican lobbyist Mike Barbera contributed a guest column that shared his views about the presidential election. Today, we feature a response from Democratic lobbyist Tom Hogan.

By Tom Hogan

Michael Barbera’s insightful piece “What the Polls Are Really Saying,” reveals a frightening proposition for today’s political observers: repeating polling data is insufficient and, to be credible, we may also have to think about and analyze political races using our own brains and original thoughts. Blasphemy. That would be like asking me to voluntarily leave my iPhone at home for a whole day. Just imagine that for a moment, like a boy in a plastic bubble, living in the real world but detached from what is being said or reported on RCP, NYT, RC, CQ, NJ, MSNBC. I could survive in there without any Fox News, but I would be cordoned off from important political babble.

I. REPUBLICANS HESITATED — I put in my notes the header, “Republicans Eat Their Own,” but this morning I softened it. The GOP abandoned McCain and Palin in 2008 and they never heartily embraced Mitt Romney in 2012, until the first debate concluded. Too little, too late. Back in 2008, with some help from Lehman Bros., Katie Couric and Tina Fey, sprinkled with some Bush fatigue, the R’s boat sank early. In 2012, the Rs toyed with B-listers, Newt, Rick and Michele. Mitt did not eat their brand of red meat, but as it has turned out they all miscalculated.

The only reason Mitt is in the game is because of Mitt. The sheer force of his skills, talent, and dogged determination won him the nomination in spite of his party’s true feelings. They finally snapped to attention the night of the first debate. A baseball bat to the head of the GOP one might say.

Most athletes and politicians will tell you that if you hesitate, even slightly, the consequences can be disastrous. Holding back support for Romney also caused Mitt to waste a draft pick. He wasted his VP pick trying to shore up conservative support in his own party. Mitt could have selected a woman, Latino, or someone who would add value in the general election. Failing to embrace Romney forced another tactical error.

The Rs used their resources to attack and demonize Pres. Barack Obama as they could not bring themselves to build Mitt’s profile. Obama boxed out criticism of his foreign policy issues as he dispatched Osama Bin Laden. So the Rs fixated on Obamacare. I can’t defend the entire 2000-plus page bill. I can, however, ask questions of those spewing invectives about it to tell me, for example: 1) What year in the past 10 did your premiums go down under the old system? 2) Which page or section of the bill can you explain is so horrible, or is the entire piece unacceptable, and why specifically? 3) Lastly, if Obama agrees to burn the law at the stake, what brilliant alternative do you have to put in place, or do we go back to old system (see question 1)?

II. PERSONAL CONNECTION — My instincts lead me to conclude that more people connect personally to Obama. I use the example of the socially awkward high school cafeteria where a new student with his tray of food looks around for a place to sit. Obama’s table looks promising. He has a diverse group of people who look and dress in varying styles, and seem laid back and inviting. Mitt’s table has the upper crust, athletic-looking guys comparing sports cars they drive, and discussing which country their families plan to visit on break.

This is simply a personal, not partisan, attribute that is more instinctive than measurable. Recall that fateful Monday in South Philly when Dem candidate John Kerry stepped to the window of the infamous Pat’s King of Steaks and ordered one of their iconic cheesesteaks. He then leaned in and requested Swiss cheese. With cameras rolling, he erred in not knowing that cheese whiz is the widely accepted cheese option (or perhaps provolone or American, but certainly NOT Swiss) in Philadelphia. I suspect Mitt would request Jarlsburg.

III. PEOPLE TEND TO AVOID CHANGE — First, to qualify what I am not talking about in reference to change, the hopey-changey mantra of 2008, was a different notion than I mean in this context. In a tip of the hat to our founding fathers’ foresight, eight years of any president leads us all to yearn for change. In a different respect, people tend to like patterns, habits, familiarity, and traditions. People seem to need a compelling reason to make drastic change, particularly when firing the president of the US is suggested.

While I agree with Mr. Barbera’s assertion that Obama may not be winning today, remember that he does not have to win until Nov. 6. One bad night in 2012 does not etch-a-sketch away all he has accomplished. It is humbling to see that he screws up like the rest of us on occasion. People are not blaming Obama entirely for international unrest, attacks on our foreign service folks, or gridlock in Congress. Speaker John Boehner was more constrained by his rigid, recalcitrant band of Tea Partiers who viewed any compromise as a sign of girly man capitulation. Give Americans more credit than to blame all this and the common cold on Obama. He has not performed well enough to earn a landslide, but he has not performed badly enough to get fired.

Lastly, how can I resist comment on The Donald. The Rs are showing signs of desperation. I first glanced at the TV and thought he was starring in the Blair Witch Project with its grainy, shaky video. Then I thought he was kidnapped by Somali pirates, but alas, he was offering $5 million for Obama’s school transcripts. Please Donald, withdraw your request for the sake of the children, or at least my children.

So, without support of polls to help me think and sound informed, I suggest that Mitt is a competent candidate, but it is not his time. Obama will not get fired, and he will win on Nov. 6.

Tom Hogan is an attorney and lobbyist with F/S Capitol Consulting in Washington, DC.

What the Polls are Really Saying

Republican lobbyist Mike Barbera contributes a guest column today, sharing his views about the presidential election. On Friday, we will feature a piece reflecting the Democratic perspective.

By Michael Barbera

It doesn’t seem to make any sense …

The American economy is burdened with sustained unemployment at levels never before seen in American history. Gas prices are through the roof. The budget deficit and national debt are both sky-high. Household incomes are down, and the housing market is still decimated all over the country. And that’s just the news here at home. Overseas, our embassies are attacked, our diplomats assassinated and our soldiers in Afghanistan are slaughtered by our so-called “allies.”

And yet according to the polls, until his poor debate performance in the first debate, Barack Obama was winning the race for the White House. In some polls he was ahead narrowly, in others he was ahead comfortably — but he was always ahead. How can that be right?

The simple fact is, it’s not. The president may or may not be ahead, but he is not winning. In fact, anyone who looks at the numbers closely realizes that the president’s electoral standing is perilous at best.

Why is it that so many talking heads have spent much time telling us that the president was winning? Quite simply, most of them read polls in a lazy and simplistic manner. Most observers only focus on the “horse race” — who is ahead and by how much. And for most of 2012, the president was ahead. So pundits simply regurgitate the numbers and pretend they know something.

At this stage of the race, horse race reporting doesn’t tell us very much. It doesn’t matter if Pres. Barack Obama leads former Massachusetts Gov. Mitt Romney by three points in Ohio or by six in Wisconsin, or whether he is ahead by one point in the Gallup poll or by five in the latest poll by the AP.

Here is what matters: how far is Pres. Obama from getting over 50 percent of the vote? And the answer, based on any fair reading of the evidence, is that he has a lot of work to do.

Look at the Real Clear Politics averages in the key battleground states. Even before Romney’s recent surge, the president was stuck between 47.1 percent and 48.8 percent in Florida, Virginia, Ohio, North Carolina, Iowa and Colorado. Karl Rove reported in the Wall Street Journal the day before the Denver debate that in 91 recent national polls “Mr. Obama was at or above the magic number of 50 percent in just 20. His average was 47.9 percent. Mr. Romney’s was 45.5 percent.”

The polls have now shifted after Romney’s strong debate performance and the president’s weak one in the first debate. The challenger cut into the president’s lead and in some cases erased it altogether.

That brings us to another popular myth about the polls — that they are constantly shifting. In fact, the president’s numbers have remained very steady. With the exception of a slight spike after the Democratic convention, the president is where he has always been — in the mid-to-high 40s. He has a solid base of loyalists, but he has not yet closed the deal with most voters — despite dominating the airwaves. According to the National Journal, as of Oct. 1, the Obama campaign spent a total of $285 million on broadcast and cable television, in addition to radio advertising, while the Romney camp spent just $117 million — and still the president was well-below the magical 50 percent mark. An incumbent stuck below 50 percent in October is an incumbent in trouble.

What has changed throughout the course of the campaign is the level of Romney’s support. This is no surprise. Like it or not, the American people have seen Obama in action. Most voters know whether they like him and whether they think he is doing a good job. Very few voters are truly undecided about him. Until very recently, many voters were very much undecided about Mitt Romney, however. That is why the president spent so much money over the summer on a steady drumbeat of negative advertising. The American people were not convinced by those ads, many of which were powerful. They wanted to decide for themselves about Mitt Romney, and a record 67 million people watched the first debate. Mitt Romney picked a good day to have a good day — and the president picked a bad day to have a bad one. Romney’s strong performance shook up the race, and he is almost certain to win decisively among late-deciding voters.

Many polls are also overstating the president’s support. These polls are using turnout models based on the 2008 election, which means the pollsters are betting that the electorate of 2012 will look a lot like the electorate of 2008. This is likely to be a losing bet.

The 2008 election featured the following: a historically unpopular Republican president, an economic meltdown one month before the election, an incredibly motivated Democratic base, a demoralized Republican base, record turnout of young voters, blacks and Latinos, and a sizable number of Republican crossover votes for Barack Obama. Does that sound like the electorate we have today? Yet many seemingly reputable pollsters construct their polling around 2008 models. I believe the technical polling term for this is “wishful thinking.”

If we look at the polls with a trained eye — and not simply repeat the horse race numbers fed to us by lazy pundits — it is clear that Obama is not winning. And if he isn’t winning now, he’s not likely to be ahead on Nov. 6.
_______________________

Michael Barbera is a lobbyist and consultant with the American Continental Group.

Tracking Ohio

It can be argued that the presidential election is coming down to Ohio. It is very likely that the eventual winner will carry the Buckeye State, and that entity will be enough to put Pres. Barack Obama or Mitt Romney over the top nationally. There are other scenarios — either candidate losing Ohio but carrying Wisconsin and Colorado, for example – but the voting patterns suggest that Ohio will choose the winner.

That being the case, let’s check the latest Ohio polls. Six separate polls measuring the Obama-Romney campaign were just released and these are the results:

• Angus Reid (Oct. 18-20; 550 likely Ohio voters):
  Obama 48%; Romney 48%
• Gravis Marketing (Oct. 18-19; 1,923 likely Ohio voters via automated calls):
  47% Tie
• Public Policy Polling (Oct. 18-20; 523 likely Ohio voters):
  Obama 49%; Romney 48%
• Pulse Opinion Research for Let Freedom Ring organization (Oct. 15; 1,000 likely Ohio voters):
  Romney 47%; Obama 46%
• Quinnipiac University (Oct. 17-20; 1,548 likely Ohio voters):
  Obama 50%; Romney 45%
• Suffolk University (Oct. 18-21; 600 likely Ohio voters):
  47% Tie

Can it be any closer? For the second time in 12 years, deciding the presidency could come down to just a handful of votes.