Tag Archives: Mitt Romney

Louisiana Data Conflict; Kasich Down in Ohio

Two days ago, a pair of polls were released into the public domain projecting that Rep. Bill Cassidy (R-LA-6) is faring well against Sen. Mary Landrieu (D). Yesterday, Public Policy Polling publicized a counter-study showing the senator to be in much better political shape, thus calling the Republican data into question. Why the stark difference? We’ll explain shortly.

The two Republican polls were conducted by OnMessage for the National Republican Senatorial Committee (NRSC) and Harper Polling for a conservative website. The OnMessage data (Aug. 12-15; 800 registered Louisiana voters) gave Sen. Landrieu only a 45-41 percent advantage over Rep. Cassidy. HP (Aug. 14-15; 596 registered Louisiana voters) found even better results for the Baton Rouge congressman, actually placing him ahead of the incumbent on a 47-45 percent count.

The PPP data (Aug. 16-19; 721 registered Louisiana voters) forecasts quite a different take. According to these results, Sen. Landrieu has a comfortable lead over Rep. Cassidy, 50-40 percent, when the two are paired in a hypothetical post-primary December 2014 run-off election.

Seeing Democratic and Republican pollsters surveying the same race at the same time but arriving at drastically different conclusions happened relatively frequently during the last election cycle. Particularly in the presidential campaign, we often saw the Republican data placing GOP nominee Mitt Romney in much better position against President Obama than was actually the case.

The chief reason for the past projection disparity was the turnout screening mechanism used in qualifying those who constituted the various sampling universes, and such is undoubtedly the case with these conflicting Louisiana numbers.

In the presidential year, the Democratic pollsters were much closer to accurately forecasting the participation model in what will prove to be the higher turnout year of 2012. Now heading into the mid-term cycle, where voting participation is always lower than in presidential elections, it may be the GOP numbers that yield the more accurate prediction.

As we know, who turns out always determines an election winner, and no one suggests that election year 2014 will be any exception to that rule. Defining the most  Continue reading >

Poll: Bachmann Already Trailing

Rep. Michele Bachmann (R-MN)

Rep. Michele Bachmann (R-MN)

Minnesota Rep. Michele Bachmann (R-MN-6) ran a boisterous campaign for president last year, but after losing the Republican nomination she retreated to her House district to quietly run for re-election … and barely won. Against first-time Democratic candidate Jim Graves, a local Twin Cities area businessman, Bachmann only captured a scant 50.5 percent majority to secure a fourth term in the House.

Often times a US Representative reaching for a higher office, particularly president, and failing in the quest, leads to a less than stellar re-election performance. Such was the case for Rep. Bachmann. A new Public Policy Polling flash survey (May 15; 500 registered MN-6 voters) suggests that the congresswoman’s political troubles are not over.

According to the PPP results, Graves, who previously announced that he will seek a re-match, has jumped out to an early 47-45 percent lead. This, in a district that 2012 Republican presidential nominee Mitt Romney carried 56-41 percent. The 6th CD is the strongest Republican district in Minnesota, which is typically a reliable blue state. Romney carried only two of the state’s eight congressional districts.

Not surprisingly, since this poll shows Bachmann trailing in a partisan district that should be strongly in the Republican column, her personal favorability index is upside down. Forty-four percent have a positive opinion of Bachmann, while 51 percent expressed holding negative feelings toward her. Graves recorded a 39:33 percent favorable to unfavorable score, which isn’t particularly good either.
 Continue reading >

Tagg — Not It!

The latest Massachusetts US Senate special election developments show that Republicans are continuing to experience political freezer burn in the harsh New England winter. The battle lines are quickly being drawn for the campaign that will yield a replacement for newly confirmed Secretary of State John Kerry.

Yesterday, Taggart “Tagg” Romney, son of former Bay State governor and 2012 GOP presidential nominee Mitt Romney, joined the group of prominent Republicans who will not become senatorial candidates. Following former Sen. Scott Brown’s decision not to run are ex-Gov. Bill Weld and former state senator and congressional candidate Richard Tisei, in addition to the younger Romney. Kerry Healey, who was Mitt Romney’s lieutenant governor, was said to be considering the race but she has taken no definitive steps to enter the contest. It is likely that the Republicans will be left with only a second-tier candidate.

There is news on the Democratic side, too. Middlesex County District Attorney Gerry Leone said he will not challenge Rep. Ed Markey (D-MA-5) or Rep. Stephen Lynch (D-MA-8) for the Democratic senatorial nomination. The move virtually assures that the two congressmen will be the only top Democrats in the race. Considering the situation on the Republican side, it further appears that the April 30 Democratic primary will ultimately determine the next senator. All early signs point to Rep. Markey being a huge favorite to win the party nomination, and now the seat.
 Continue reading >

West Out; Sanford In

FL-18

Former Rep. Allen West (R-FL), just after joining Internet-based PJ Media as a political pundit, says he will not seek a re-match with Rep. Patrick Murphy (R-FL-18) next year.

West originally was elected in Florida’s 22nd District, defeating two-term incumbent Ron Klein (D) in 2010. Redistricting made the 22nd CD heavily Democratic, as evidenced by Rep. Lois Frankel’s (D) win over Republican Adam Hasner (R), despite a strong campaign from the latter. Instead of staying in the Palm Beach seat, West bolted north to run in the open 18th District, a seat more hospitable to Republicans but containing only about one-third of his original voters. West failed to win a second term in a tight outcome.

Look for the GOP to make the 18th a heavy Republican target, but with a new candidate. The name being mentioned most often is that of former state Rep. Joe Negron, who ran an almost impossible race in 2006. When Rep. Mark Foley (R-FL-16) resigned his seat in disgrace, Negron was chosen as the GOP replacement nominee but, under a Florida election law quirk, voters still had to vote for Foley in order to support him since the change in nominees came after the ballots were printed. Needless to say, Negron failed to overcome this obstacle despite a valiant campaign Continue reading >

Pennsylvania Electoral Votes

Pennsylvania state Senate Majority Leader Dominic Pileggi (R) is at it again. In the last legislative session, Pileggi introduced legislation to apportion Pennsylvania’s electoral votes as opposed to continuing the winner-take-all system. Maine and Nebraska already split their small number of electoral votes, hence there is precedence for a state deciding to divide its presidential EV allotment.

In the period prior to the 2012 presidential election, Pennsylvania was viewed to be a battleground entity and the state bifurcating its votes would have undoubtedly helped the Republican nominee. The Pileggi bill would have awarded two votes to the presidential candidate winning the statewide vote and one apiece for each of the 18 Pennsylvania congressional districts.

Sen. Pileggi was unable to pass his bill because the state’s marginal district Republican congressmen were opposed to the concept. They believed the presidential campaigns targeting their specific districts for individual electoral votes would potentially make their own road to re-election more difficult. They convinced enough of their state legislative colleagues to derail the effort.

Now Pileggi has a different approach. His new bill will still award two votes for the presidential candidate winning the statewide vote, but then apportion the remaining 18 EVs based upon popular vote percentage for the candidates on the statewide ballot. Since Pennsylvania is a Democratic state, but a close one (in 2012 President Obama carried PA 52-47 percent, for example), the winning candidate (Obama) would have received the two at-large votes plus another 10 based upon winning 52 percent of the popular vote instead of 20 under winner-take-all. Republican nominee Mitt Romney would have received eight votes. The PA vote totals would more than likely split this way – the winner receiving 12, the loser eight – in virtually every election.

It remains to be seen if the senator can gather enough support among Republicans — Democrats will not support the idea because it will weaken their nominee — in both houses of the legislature in order to send the bill to Gov. Tom Corbett (R). But, one major obstacle — Republican congressional opposition — has ostensibly been eliminated under this new approach.

Unexpected Voter Turnout Patterns

We wish you the best for the happiest of Thanksgiving holidays. The PRIsm Political Updates will return Monday, Nov. 26.

The official state participation and candidate preference statistics are being released throughout the nation, and many of the numbers are quite surprising. While turnout was down nationally, it was up in most of the battleground states and, despite Pres. Barack Obama’s victory, it may be erroneous to assume that the turnout pattern completely favored him.

While it is clear the president obviously benefited from the voting preferences of the aggregate group of people who cast ballots during the election process, it is interesting to note that he was only able to return 91.5 percent of the total vote he received in 2008. In contrast, losing national Republican nominee Mitt Romney retained 99.4 percent of John McCain’s 2008 vote. Obviously Romney needed to do better than to simply equal McCain’s vote, but it is significant that Obama’s share of the vote declined by almost a full 10 percent from what he obtained four years ago, especially when understanding that the Obama campaign clearly had the superior grassroots organization.

Nationally, and rather astonishingly from what was widely forecast before the election, overall voter turnout was down six million votes from the number cast in 2008, or a fall-off of 4.7 percent. It appears that virtually all of the drop-off came from the Obama coalition, as the president’s vote receded by almost that same amount as did the national turnout (voter participation reduction: 6,148,768 individuals; Obama drop: 5,917,631 votes).

The four core states also recorded interesting turnout patterns. Of the quartet of places that Romney needed to convert if he were to unseat the president, it was North Carolina — the only state in this group that he did carry — that had the highest participation rate increase from 2008. North Carolina voter turnout was up 4.5 percent in comparison to their aggregate number of voters from four years ago. Virginia and Florida, two of the three core states that remained with the president, also saw increased participation. Virginia was up 3.5 percent; Florida 1.0 percent.

Ohio, often believed to be the most important state in the presidential contest because it was viewed to be a national bellwether, surprisingly recorded a lower turnout this year than during the previous Obama victory campaign. Ohio turnout was down a rather substantial 5.9 percent, or greater than 336,000 participants from 2008.

Of those seven states commonly viewed to be in the secondary target group — at least one of which Romney would have had to have carried to be successful, more if he failed to carry all of the core states — four saw increased participation, and three declined. The states producing a greater number of voters were in the Midwest (Wisconsin, up 2.4 percent; Iowa, increasing 1.9 percent) and West (fast-growing Nevada adding 4.5 percent; Colorado, up 3.1 percent).

The three eastern and Mid-Atlantic states all recorded a smaller voter participation rate. Pennsylvania, always considered a swing state and a place that attracts a great deal of campaign attention, saw its voter turnout rate fall 6.1 percent; Michigan, the only state in the Union that actually lost population in the preceding decade, dropped 5.7 percent; and New Hampshire returned almost the same number of voters, coming in just 5,091 ballots under their 2008 total.

It appears the biggest voter drop-off occurred in some of the nation’s largest states, those that are most Democratic and among the president’s strongest places. His home state of Illinois, for example, saw more than 431,000, or 7.8 percent, fewer people vote this year than when compared to their favorite son’s first election in 2008. New York had the largest drop-off, a stunning 19.8 percent below its participation level of four years ago. California, the nation’s largest state, was off 12.5 percent. But, lower turnout rates were not confined only to the large Democratic states. Texas, the biggest and most loyal Republican entity, also saw a reduction in turnout. Over 112,000 fewer voters went to the polls in 2012 when compared to 2008.

More analysis will be completed when additional data is available, but these statewide turnout numbers may have produced more questions about the nation’s voting patterns than answers.

Virginia Numbers Tell the Tale

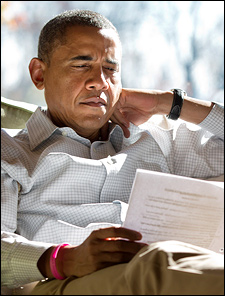
(Official White House Photo by Pete Souza)

The Virginia State Board of Elections just released their 2012 results segmented by congressional district, the first state to do so, and the data give us further insight as to why Pres. Barack Obama again carried the Old Dominion. The state was long known to be one of the determining voting entities of the campaign, therefore the refined and newly released information carries national significance.

Statewide, voter turnout was reported to be 75.9 percent of the registered voters recorded as “active” by the Virginia state elections officials. The highest turnout district was that of House Majority Leader Eric Cantor (R-VA-7), as 82.8 percent of the central Virginia active registered voters participated. The lowest turnout rate was found in Rep. Gerry Connolly’s (D) northern Virginia 11th District where only 68.9 percent of active registered voters went to the polls.

At the congressional level, eight of the 11 districts were drawn to favor Republicans. The map performed as designed, because the eight GOP congressional incumbents all won re-election. In the presidential race, however, Obama obviously outperformed his Democratic congressional running mates, but only carried one more district than they. Obama won Districts 2 (Rep. Scott Rigell-R), 3 (Rep. Bobby Scott-D), 8 (Rep. Jim Moran-D), and 11 (Rep. Connolly). Therefore, despite GOP nominee Mitt Romney carrying seven of 11 congressional districts, he still lost the state. Obama’s official margin over Romney was 149,279 votes, meaning at least this many people are ballot switchers or did not vote in their individual congressional race.

Perhaps the most extraordinary finding is how Romney’s performance compared to the Republican congressional candidates. In all but one CD, the Republican congressional candidate recorded more votes than Romney. The lone exception was the western-most 9th District, commonly called “The Fighting Ninth” or the “coal district.” Here, Romney scored 11,456 votes more than Rep. Morgan Griffith (R), even though the latter was winning a convincing 61.3 percent re-election victory.

But it is the Northern Virginia seats where the most eye-opening results occurred. Despite not running competitive campaigns against Reps. Moran and Connolly, Republican candidates J. Patrick Murray and Chris Perkins in Districts 8 and 11, respectively, actually recorded more votes than did Romney. Murray secured 4,933 more votes than the Republican presidential nominee; Perkins garnered 9,441 tallies greater than Romney’s total. But none can come close to the results found in the new 10th District, where veteran Rep. Frank Wolf (R) out-polled Romney by 38,362 votes.

To put this in perspective, even though Murray received only 30.6 percent support against Moran and Perkins 35.5 percent in opposing Connolly, more people voted for them in these two districts than for Romney.

The other determining region was the Tidewater area, where the former Massachusetts governor failed to carry Rep. Rigell’s District 2 (he scored 48.6 percent there) and ran 12,466 votes behind the congressman, who won his first re-election with 53.7 percent. The other marginal Republican Tidewater CD, Rep. Randy Forbes’ (R) 4th District, showed an even greater difference between Romney and the congressional candidate. Here, Forbes ran 18,287 votes ahead of the man at the top of his party’s ticket. Romney eked out a 50.1 percent win over Obama, while Forbes racked up 56.9 percent in clinching his sixth re-election.

Comparing the presidential and congressional races to the Senate campaign between eventual winner Tim Kaine (D), the state’s former governor, and ex-Sen. George Allen (R), it was the Democratic candidate who carried the majority of the congressional seats — six to the Republican’s five. In addition to the seats that went for Obama (Districts 2, 3, 8 and 11), Kaine also carried Republican districts 4 and 10.

In more Virginia news, Quinnipiac University (Nov. 8-12; 1,469 registered Virginia voters) just released the first public survey of next year’s gubernatorial contest. Not surprisingly, the results determined that popular Sen. Mark Warner (D) would easily defeat both known Republican aspirants, Lt. Gov. Bill Bolling and Attorney General Ken Cuccinelli. Warner’s margins are 53-33 percent over Bolling and a similar 56-33 percent when paired with Cuccinelli. There has been speculation that Warner might enter the state’s 2013 governor’s race, thus giving him a better platform from which to launch a presidential campaign in 2016.

Former Democratic National Committee chairman and 2009 gubernatorial candidate Terry McAuliffe was likewise tested against the two Republicans. These match-ups suggest a much closer statewide race. Against Bolling, McAuliffe jumps out to a slight 38-36 percent lead; the margin becomes 41-37 percent when Cuccinelli is inserted as the hypothetical Republican nominee.