Category Archives: Apportionment

Early House Outlook – Part I

By Jim Ellis

Jan. 20, 2021 — With the presidential Inauguration dominating political attention this week, it is a good time to set the upcoming electoral stage for the US House on a 50-state basis. Today, a first of a four-part series, will begin to look at the 13 western states. During the rest of the week, we will move eastward.


• Alaska – 1 Seat (1R)
Rep. Don Young (R-Ft. Yukon), the Dean of the House, won his 25th term in November with a 54-45 percent victory in a competitive race. With Alaska being an at-large state, reapportionment and redistricting won’t change the political situation. The big question surrounding the 87-year-old congressional veteran is when will he retire?


• Arizona – 9 Seats (5D4R)
The Arizona population growth rate makes them a cinch to gain a 10th District in reapportionment. It is also clear that the new seat will be placed in the Phoenix metropolitan area. Arizona has a redistricting commission comprised of two Democrats, two Republicans, and one Independent. The latter member becomes the chairman. The membership has not yet been chosen.

The state’s marginal nature suggests that we will see a very competitive state once all 10 seats are in place. Currently, there are two districts where the winning House member received 52 percent of the vote or less. This means GOP Rep. David Schweikert (2020 winning percentage: 52.2) and Democratic incumbent Tom O’Halleran (2020 winning percentage: 51.6) will be looking to add more Republicans and Democrats to their seats, respectively.

An open governor’s race (Republican Gov. Doug Ducey ineligible to seek a third term) and what should be a competitive re-election for Sen. Mark Kelly (D) could cause open seats in the House delegation should any of the sitting members attempt to run statewide.


• California – 53 Seats (42D11R)
For the first time in history, the Golden State appears positioned to lose a seat in their US House delegation. With migration exiting the state exceeding those incoming, it appears the California growth rate did not keep up with the specified threshold in order to keep all of their 53 seats. The Los Angeles area is likely to absorb the loss of the seat, but which member will be paired with another is an open question.

California voters adopted an initiative before the 2010 census that established a citizens’ commission to administer redistricting under strict parameters that emphasizes keeping cities and counties whole when possible and irrespective of where any particular incumbent may reside. Therefore, with the mapping power removed from the legislature, it is possible that inside Democratic politics might play a lesser role in the redistricting process.

Continue reading

The Losing Regions – Part II

All the best for a great holiday break. The Political Updates will return on Monday, Jan. 4.

A look at how things might play out in key states in the redistricting tug of wars

By Jim Ellis
Dec. 24, 2020 — Continuing our two-part series of examining reapportionment projections for states expected to lose congressional seats, today we look at an additional four states with CDs on the chopping block: Illinois, New York, Ohio, and Pennsylvania.

At this point, it appears a total of ten states are in the losing category. Yesterday, we covered Alabama, California, Michigan, and Minnesota. The remaining two, Rhode Island and West Virginia, are moving to at-large and two district status, respectively, meaning their new maps become obvious.

The new apportionment, originally due at the end of this year but delayed due to COVID, could be released sometime in January.


Illinois

Illinois is a sure loser and one of the few states where the overall population is less (over 158,000 people) according the latest available numbers (July 2019) than registered 10 years ago. Therefore, Illinois is in the rare situation of losing congressional representation not because the population failed to keep pace with the rate of growth, but rather due to the entity actually having fewer people.

This leads to speculation that the state could lose two seats because even in such a scenario the per district population number would be under 800,000 individuals. A two-seat loss would still render the state with a lesser per district total population figure than some of the other states losing one.

All current 18 Illinois CDs need to gain population even under a one-seat loss scenario. Making such calculations we see that the new rudimentary per district population figure would be approximately 745,401 individuals, less than the number projected for most states. Typically, states losing congressional districts feature much higher numbers. This adds to the speculation that the state could drop a second CD.

If the loss is only one, as the current projection formula suggests, the southern part of the state would appear to take the hit. This means that Republicans, while holding only five of the state’s current 18 districts, would likely lose a seat. Aside from Rep. Cheri Bustos’ (D-Moline) 17th District anchored in the Quad Cities region, which has the largest population number to gain, over 79,000 people, the remaining seven of the top eight districts needing a population increase come from the Downstate region.

The figures suggest that combining the five central and southern districts of Reps. Mike Bost (R-Murphysboro), Rodney Davis (R-Taylorville), incoming freshman Mary Miller (R), Adam Kinzinger (R-Channahon), and Darin LaHood (R-Peoria) into four districts would be the most likely scenario unless the Bustos district is collapsed. Considering that the Democrats control the redistricting process, it is probable that the former scenario would be the one adopted.


New York

Like Illinois, New York, while having slightly more people than they did in 2010 (just over 75,000 more according to July 2019 estimated figures), could be on the cusp of losing two seats. Of their current 27 districts, 24 must gain population. Only the seats of Reps. Hakeem Jeffries (D-Brooklyn), Gregory Meeks (D-Queens), and Adriano Espaillat (D-Bronx) are in the position of shedding residents. All others need a population influx even to reach the approximated 748,213 figure that appears be present at this point for a 26-District model.

As in Illinois, a two-seat loss would still keep the per district number at well under 800,000, much less than other states that are projected to lose congressional representation.

Also as in Illinois, the non-urban area looks to need the largest population gain (meaning Upstate, in this case), would contain the area most prone to lose a seat. This means, also as in Illinois, that the party in a small minority, the Republicans, is most likely the one on the chopping block.

Continue reading

The Losing Regions – Part I

By Jim Ellis

Dec. 23, 2020 — With the Census Bureau readying the national apportionment formula to present to the Clerk of the House at some point next month, it is a reasonable time to again look at the states projected to lose congressional districts and begin to determine where a dragging population could cost a region its current representation.

Today, we look at four states projected to lose a district: Alabama, California, Michigan, and Minnesota. Tomorrow, we will examine Illinois, Ohio, Pennsylvania, and New York. Rhode Island and West Virginia are also going to lose seats but because they are two- and three-district states, the new redistricting map becomes obvious, particularly in the former’s case.


Alabama

The Alabama population suggests that it is too small to keep its seventh congressional district, but such makes the remaining six districts very large, likely well over population figures of 800,000 residents apiece. It is an ironic problem for the states losing districts in that the remaining CDs actually become much larger. If Alabama is on the losing end in final reapportionment, the scenario of dropping a district and making the remaining seats much larger will certainly come to pass.

As with all redistricting, those in a corner of a state, i.e., either bordered by another state, body of water, or country are in the best shape because their districts can only expand or contract one or two ways. In Alabama, the 1st and 5th CDs, those of incoming Rep. Jerry Carl (R-Mobile) and Mo Brooks (R-Huntsville) are in the most favorable geographic positions.

The district appearing to lose the most population is Rep. Terri Sewell’s (D-Birmingham) 7th CD, but this is a protected Civil Rights district meaning it must be protected. The seat could need to gain almost 150,000 people according to rudimentary calculations, and the most likely place for the increase comes from Montgomery County at the expense of the 2nd District and possibly the 3rd.

The 2nd District, even when bordered by states on two sides, appears the most vulnerable to collapse. Needing to likely gain over 140,000 individuals before almost certainly losing population to the current 7th District, the collapsing of the 2nd and 3rd Districts into one seat appears to be a potential outcome. This would place incoming freshman Rep. Barry Moore (R-Enterprise) and veteran Congressman Mike Rogers (R-Anniston) in the same district.


California

For the first time in history, California looks to lose congressional representation. In the last census, the state remained constant for the first time. In every previous census apportionment, the Golden State had gained representation. In the 1980 census, for example, California gained seven new congressional districts. Now, it appears they will reduce representation from 53 to 52 seats, but still be the most populous state by a wide stretch.

The region not keeping up with the rate of growth appears to occur in the southern California expanse from Bakersfield through Los Angeles County and portions of Riverside, Orange, and San Bernardino Counties. Such a region covers 18 congressional districts, 16 of which will need to gain population under a rudimentary calculation suggesting that each of the state’s 52 CDs will require approximately 760,000 residents. Of the 18 districts, Democrats represent 15 and Republicans’ three.

Only two of these 18 districts, those of Reps. Brad Sherman (D-Sherman Oaks) and Norma Torres (D-Pomona), are either at or slightly over the approximated population goal.

Continue reading

Florida Data

By Jim Ellis

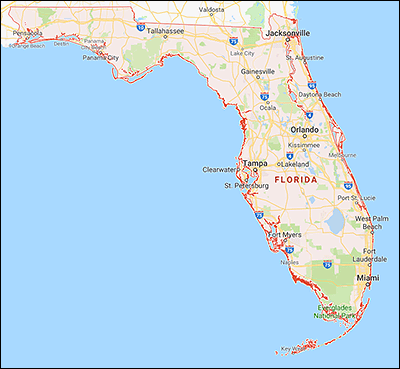
Dec. 18, 2020 — Continuing with our project this week of analyzing statewide data now that official final election results are being published from around the country, today we look at the Sunshine State of Florida, another key redistricting state.

Though having only three-quarters of Texas’ population, the Florida presidential turnout came within only a few hundred to equaling that of the Lone Star State (FL: 11,067,366; TX: 11,315,056).

On the statewide tally, President Trump carried Florida with a 51.2 – 47.5 percent margin over former vice president Joe Biden. The result represents a net 2.2 percentage increase for the president when compared with his 2016 statewide total, while Biden’s performance registered a decline of 0.3 percent from Hillary Clinton’s Sunshine State aggregate vote.

The House performance detected in California and Texas, showing that the average victorious congressional candidate performed better within their particular district than President Trump, was not nearly as pronounced in Florida.

On average, Texas US House Republican candidates ran 2.8 percentage points better than Trump, and the average California GOP House candidate ran 4.2 points ahead of the president’s statewide percentage. In Florida, however, the number was virtually equal to the president’s, with the average House Republican contender running just 0.2 percent above Trump’s statewide total.

Because two of the Republican incumbents, Reps. Neal Dunn (R-Panama City) and Mario Diaz-Balart (R-Miami/Hialeah), ran either without Democratic opposition (Dunn) or totally unopposed (Diaz-Balart) the Florida Secretary of State does not record votes in such a district. Therefore, for purposes of this exercise, a projected result of 65-35 percent for the two congressional districts was added as an estimated total. This percentage spread was extrapolated when comparing the performance of Republican and Democratic congressional candidates in similar Florida districts.

To review, in California, Democratic House incumbent performance fell below their 2018 recorded vote in 33 of 44 districts, while results improved for four of the six Republican incumbents on the ballot. In Texas, vote percentages for 11 of the 16 Republican incumbents seeking re-election improved from 2018, while the Democratic incumbent performance index declined for all 13 who ran for a succeeding term.

Continue reading

COVID & Redistricting

By Jim Ellis

April 29, 2020 — The deadline for the Census Bureau to release the new population data is March 31, 2021, but with the entire process being delayed due to COVID-19 precautions, the ability to meet the requirement is becoming more difficult by the day. Already, the Bureau has been delayed in dispatching their door-to-door teams necessary in obtaining the responses from people who did not return their mail tabulation form.

The Trump Administration is reportedly suggesting that the March 31 deadline be postponed to sometime in the summer of 2021. If this happens, we will see a series of redistricting problems ignited in the states. First, the political leaders in New Jersey and Virginia, places that have 2021 elections and need their new state legislative lines in place well before that date, would find themselves in a difficult position.

Initially, the two states would certainly have to postpone their primary elections because both nominate their general election candidates in June. Beyond that, it is possible they would have to even postpone their general elections into 2020 or run in the obsolete boundaries that were drawn back in 2011. In either case, we could expect lawsuits being launched from whichever party loses a particular electoral contest.

Other states would be affected, too. Many have legal deadlines in place mandating that the new redistricting maps for state legislature and the US House delegation be adopted before the legislative sessions ends. Most states recess before mid-summer, which would mean special sessions being called if the legislature is to act.

The problem intensifies in the states that are either gaining or losing congressional districts in reapportionment. Currently, it appears that seven states will add seats to their delegations (the best projections suggest that Texas will gain three, Florida two, and Arizona, Colorado, Montana, North Carolina, and Oregon one apiece), while 10 will lose single districts (Alabama, California [for the first time in history], Illinois, Michigan, Minnesota, New York, Ohio, Pennsylvania, Rhode Island, and West Virginia).

The aforementioned apportionment is based upon calculations released publicly and not, of course, using the actual numbers. Therefore, we could see some differences between these projections and what the formulas actually produce when the Census Bureau finally can produce the updated real figures.

Continue reading

New House Census Projections

By Jim Ellis

Jan. 3, 2020 — The Census Bureau just released its new population growth estimates for the 12-month period between July 1, 2018 and July 1, 2019. Their data allows us to assess just which states will likely gain and lose congressional districts in 2020 reapportionment, both in terms of the real numbers just presented and for projecting the final count once the decade’s final-year patterns are calculated and the census is actually conducted.

The national population growth rate was analyzed to be 0.5 percent, down from the peak period of the decade, the July 1, 2014 through July 1, 2015 time segment, when the growth factor reached 0.73 percent. The population patterns of movement to the south and west continue, with the northeast actually seeing a population decrease during the aforementioned reported 12-month period that ended on July 1. The Midwest is not keeping up with the national rate of growth, either, but not losing overall population.

Ten states actually lost population during the reported period, led by West Virginia’s 0.7 percent drop. Alaska declined by 0.5 percent, with New York and Illinois each losing 0.4 percent. Hawaii dropped by 0.3 percent, Connecticut, Louisiana and Mississippi 0.2 percent, and Vermont (0.1 percent). New Jersey is the tenth population reduction state, but it lost only 3,835 people from a population of more than 8.9 million individuals for a 0.0004 percent decrease.

The fastest growing states at this point in the decade are Idaho (2.1 percent since July 1, 2010), Nevada, Arizona, and Utah (all at 1.7 percent increase during the same period), Texas and South Carolina (1.3 percent), Washington and Colorado (1.2 percent), Florida (1.1 percent), and North Carolina (1.0 percent).

Continue reading

Unending North Carolina Redistricting

By Jim Ellis

Nov. 20, 2019 — If it seems like the North Carolina redistricting process has dragged on for the entire decade, then your senses are correct, because it has. After seeing a mid-decade re-draw before the 2016 elections, another set of lines will be in place for 2020, and then another plan for the ensuing electoral decade beginning in 2022 will be enacted during the regular decennial process. North Carolina is a sure bet to gain a new congressional seat in 2020 reapportionment.

Last week, the Republican legislature produced a new map per court order that will concede two more seats to the Democrats. This plan is not final, however, as the new map still has must clear the legal process and certainly the Democrats will challenge in an attempt to get more. Republicans will counter and attempt to move the process away from the state three-judge panel which has been favorable to the Democratic arguments, and into federal court where they feel their own points may be given a more sympathetic hearing.

Racial gerrymandering was the subject of the original challenges, but when those arguments led to a new map without a net gain of Democratic seats, the plaintiffs filed political gerrymandering lawsuits. With the Supreme Court basically returning the political gerrymandering arguments back to the state courts, the Democrats, at least in North Carolina, are in much better position to get a map that better reflects their intended outcome.

With the current split being 10R-3D, which of the current members are in the deepest trouble under the new map? Though the map looks fundamentally similar to the current plan, there are sizable differences in district configuration from a political context.

The Daily Kos Elections site ran a voting analysis of the new seats, and it appears a new Tar Heel State delegation under this map would feature eight Republicans and five Democrats, or a net gain of two seats for the latter party.

The two current incumbents who would not likely return under the plan are Reps. George Holding (R-Raleigh) and Mark Walker (R-Greensboro). Their districts go from being a plus-10 Trump district for Holding to a minus-14 CD, and for Walker an original plus-15 Trump to a minus-11.

Continue reading