
Tag Archives: Former President Trump

Pew’s Post-Election Findings

By Jim Ellis

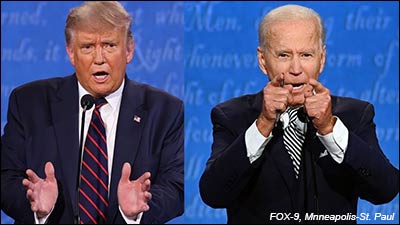
The candidates in action at the first presidential debate in Cleveland, Ohio: President Donald Trump (left) and former vice president Joe Biden.

July 8, 2021 — The Pew Research Center conducted a post-election poll and spent seven months developing their conclusions. On the last day of June, they publicized their report.

The study, conducted just after the November election (Nov. 7-12; 11,818 individuals through groups of screened panelists, online) was exhaustive.

Quoting the methodology description, “noncitizens and those who refused the citizenship question (N=450), voters who refused to answer the vote choice question (N=84) and panelists who declined to provide their names and thus could not be matched to a voter record (N=139) were removed, leaving 11,145 panelists for analysis.” Of this latter number, 9,668 respondents were validated as voters, meaning the research team verified with a local election office that the particular individual had in fact voted.

The basic voter segmentation conclusions were speculated upon in most media sectors during the early post-election period, but this research validates and expands upon the discovered patterns. Largely, President Biden received a significant boost from suburban voters, which proved the major difference in his increasing Democratic popular vote performance.

Despite losing the popular vote by a substantial margin, former President Trump surprisingly improved his standing with several groups such as Hispanics, Asians, black men, young voters, and women, but not to the degree necessary to counter Biden’s strength with suburban voters.

For example, among suburban voters, according to the Pew research, Biden recorded 54 percent support as compared to Hillary Clinton’s 45 percent in the 2016 election. Conversely, Trump only carried white voters 51-47 percent in the most current election, a major reduction from the 54-38 percent spread he posted four years earlier.

While Trump declined in the suburbs, his performance among rural voters was even stronger than his 2016 benchmark. In 2020, Trump’s percentage among rural voters rose to 65 percent from his 59 percent previous showing. Additionally, rural female voters largely account for his overall increase among women as he moved from 39 percent in ’16 to 44 percent in 2020.

Continue reading

Biden-Trump Swings in 2020

By Jim Ellis

March 9, 2021 — The Daily Kos Elections website completed their analysis of the congressional districts that changed the most when comparing the 2020 presidential vote performance to that of 2016. The list is divided into the top 25 districts from two categories, those that swung the most to Joe Biden from Hillary Clinton and the seats where Donald Trump improved to the greatest degree when compared to his 2016 showing.

Perhaps the more interesting chart is the Trump improvement calculations, because every one of the top 25 D to R swing districts has a substantial minority population, particularly Hispanic. In fact, in these 25 CDs, the average Hispanic population figure is 59.8 percent, and we see a mean average improvement swing of 12.3 percent for Trump in 2020 with a median of 11.5 percent when compared with his 2016 standing in these districts.

DISTRICT | WINNER  |   HOUSE 2020 % | PRES. 2020 % | HOUSE WINNER | HISPANIC %
FL-26 Trump   52-47 52-47 Gimenez 68.6
FL-25 Trump   61-38 Unopposed Diaz-Balart 75.8
TX-34 Biden   52-47 55-42 Vela 83.7
FL-27 Biden   51-48 51-49 Salazar 70.4
FL-24 Biden   75-24 76-20 Wilson 37.0
TX-28 Biden   52-47 58-39 Cuellar 77.4
NY-15 Biden   86-13 89-11 Torres, R. 66.1
TX-15 Biden   50-49 50-48 Gonzalez 81.2
CA-51 Biden   67-31 69-32 Vargas 70.1
CA-40 Biden   77-21 73-27 Roybal-Allard 87.6
TX-29 Biden   66-33 71-27 Garcia 77.1
NY-7 Biden   82-17 85-14 Velazquez 41.8
CA-44 Biden   78-19 68-32* Barragan 70.0
CA-29 Biden   74-24 57-43* Cardenas 68.7
NY-14 Biden   73-26 72-27 Ocasio-Cortez 49.1
NY-13 Biden   88-11 91-8 Espaillat 54.5
CA-19 Biden   70-28 72-28 Lofgren 40.8
FL-23 Biden   58-41 58-42 Wasserman-Schultz 35.5
CA-34 Biden   81-17 53-47* Gomez, J. 64.3
TX-9 Biden   76-23 75-22 Green, A. 38.5
NY-6 Biden   62-37 68-32 Meng 19.2
CA-35 Biden   65-33 69-31 Torres, N. 70.0
CA-46 Biden   64-33 69-31 Correa 66.4
NJ-8 Biden   73-26 74-25 Sires 54.4
PA-2 Biden   70-29 72-28 Boyle 27.9

* Faced another Democrat in general election
• Avg. Swing 12.3 | Median 11.5 | Average Hispanic percent: 59.8%


Biden Swing

Obviously, President Biden still won all but two of these districts, and the vast majority with overwhelming percentages. Even so, the fact that so many of the Hispanic districts were giving former President Trump a double-digit vote total increase is significant, nonetheless. This could be a positive 2020 presidential campaign after-effect upon which the Republican Party can build.

As you will see similarly in the districts below that swung significantly to Biden, only one of the Trump improvement seats performed differently at the House level when compared to that same electorate’s presidential vote. The one CD of the 25 swings that voted Biden for president and a Republican for House was Florida’s 27th District as Maria Elvira Salazar (R) upset incumbent Rep. Donna Shalala (D-Miami).

Of the districts that showed the most significant gain for Trump we look to South Texas. This contrasts greatly with the vote changes in North Texas. As we can see, ex-President Trump showed significant improvement in all of the Texas-Mexican border districts.

The district with the sharpest Trump swing was Florida’s 26th District, with a 21.9 percent factor. The lowest of the 25 were New Jersey’s 8th and Pennsylvania’s 2nd CDs, both with a 7.0 percentage improvement for the Republican former president.

The chart immediately below shows the top 25 districts that produced the sharpest swing for the race winner, President Biden. Remember, the 2016 Democratic number was that of Hillary Clinton.
Continue reading