By Jim Ellis
May 10, 2018 — Looking at the voting patterns for Tuesday’s primaries in the four states holding elections, we see little evidence of the reported “blue wave” often discussed in media analyst reports — meaning a surge in Democratic Party voter turnout — but there is also sparse information to determine specific participation trends in many of the noted places.
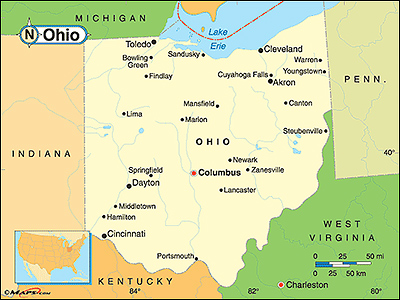
 Ohio has the most complete data to compare totals for midterm elections dating back to 2006. On Tuesday, 1,506,777 people voted in the two major party primary elections, with just about 55 percent recorded in the Republican gubernatorial contest. The current grand total was the second largest participation figure in the four midterms since 2006, inclusive. The 1.506 million aggregate total was second only to the 2006 turnout that saw 1.626 million Ohioans voting. This year, both parties featured open gubernatorial primaries, each with a clear leader heading into Election Day.
In all four of the tested Ohio midterms, more people voted in the Republican primary. The 54.9 percent participation factor when measuring the two parties against each other on Tuesday night was the second highest of the sampled four. Only the Republicans’ 56.0 percent participation rate in 2014 was stronger. To put the current rate in perspective, the GOP low occurred in 2006 when 50.8 percent of primary voters cast a Republican ballot. In the succeeding general election, Democrat Ted Strickland would win the governor’s campaign, making the result consistent with the higher Democratic primary participation rate.
In the Buckeye State House races, eight of the 16 districts featured primary elections for both parties. In each of the districts holding primaries for both parties, the political entity controlling the seat before the election saw more people vote in that party’s primary. The most significant race was the special primary election in the 12th District, the seat former Rep. Pat Tiberi (R) vacated to return to the private sector. There, 23,902 more people voted in the Republican primary, thus providing some tangible support for predicting the state Sen. Troy Balderson (R-Zanesville) is favored to win the seat in the Aug. 7 special general vote.
In West Virginia, more people again voted in the Democratic primary: 54.0 percent of the 296,111 individuals that participated on Tuesday voted either for Sen. Joe Manchin or his Democratic opponent, Paul Jean Swearengin. But there was a lower percentage voting in the Dem primary than in the three tested midterms since 2006. The 2010 midterm was not included because there was no statewide primary. There was not a West Virginia Senate race in the 2010 cycle, and the state’s governor’s elections run in presidential years. In 2014, 61.1 percent of those voting did so in the Democratic primary. In 2006, Sen. Robert Byrd’s (D) last election, 69.5 percent of the voters cast a Democratic ballot.
It’s unlikely that the primary turnout gives us much of a basis for a general election prediction, however. In 2014, when 61.1 percent of the voters cast a Democratic primary ballot, then-Rep. Shelley Moore Capito, the Republican Senate nominee, would garner 62.1 percent of the general election vote.
Tuesday’s Indiana turnout numbers don’t provide us much, either, because Sen. Joe Donnelly (D) ran unopposed in the Democratic primary, the governor’s race also runs in presidential years, and no midterm during the tested time frame (2006-2018) featured simultaneous statewide Democratic and Republican primary elections. Here, in the seven Republican congressional districts, more people voted in the GOP primary. Likewise, for Democrats in the two Democratic districts.
In North Carolina, with no statewide race on the ballot and its governors also elected in presidential years, there is very little data that can be used to derive turnout patterns. At the congressional level on Tuesday, just five of the 13 CDs had primaries in both parties. Here, in Republican Districts 2 (Rep. George Holding-R) and 9 (where Rep. Bob Pittenger lost to former pastor Mark Harris-R), more Democrats than Republicans voted in the primary. This is the best news of the night for the Dems, and could be an indicator of increased Democratic intensity for the North Carolina general election.
The participation rates in the four states appear to be relatively consistent with previous voting history and appear to yield normal turnout trends for both parties in most instances.
