By Jim Ellis
March 20, 2019 — In most elections, particularly in today’s polarized political climate, the independent vote is often the determining factor. As the non-affiliated share grows within the American electorate, these individuals become even more important.
But, who are the independents and how different are they from the average partisan Republican or Democrat? The Pew Research Center released a new study at the end of last week about the independent voter. Their data sources were a compilation of polls taken during the past few years, up to and including 2019.
The Pew conclusions are interesting in that the study basically reveals the lion’s share of independents align very closely with partisan Republicans and Democrats. Or, in other words, they generally vote with one party or the other, hold similar views and values as one of the major parties, but don’t want to associate themselves with the particular entity.
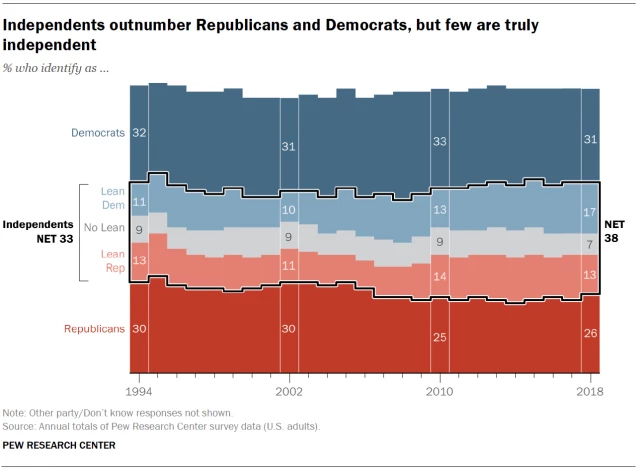
More at Pew Research Center | Graphic by Pew
Based upon the sourced data, Pew denotes that approximately 38 percent of the electorate considers themselves to be independent. This compares with 31 percent who self-identify as Democrats and 26 percent who say they are Republican. Within the aggregate independent segment, 46 percent align with the Democrats while 35 percent identify with Republicans. Therefore, 19 percent of this group can be considered the true swing voter.
While those identifying more closely with the Republican Party are fewer, they have a higher voter turnout proclivity. According to the 2018 midterm election statistics, 54 percent of the Independent/Lean Republicans cast a ballot versus 48 percent of those generally identifying with the Democrats. The greater turnout figure for Republicans, even in a more Democratic year like 2018, suggest that the two parties are basically at parity within the independent voting sector.
Furthermore, those who consider themselves as true independents have a much lower participation rate. In the 2018 election, just 33 percent of those claiming not to lean toward a particular political party actually voted.
On issues, the independents break about how one would expect. They generally tend to move in the direction of the party to which they identify on most issues but are not as extreme.
Whether the issues are social, economic, or relate to foreign affairs, the aggregate independent sector generally comes down between the Democrats and Republicans, but those who consistently lean toward one party do so almost as stringently as the partisan voter.
Perhaps the issue area that best captures the difference among the three independent subsets (lean Democrat; lean Republican; true Independent) and how the leaners mirror their preferred party are in the areas of government size and business regulation.
In answering the question of whether the respondent would prefer a smaller government that provides fewer services or a bigger one that provides more services, the total electorate polls 46-46 percent. Not surprisingly, Republicans break 74-20 percent in favor of smaller government, while Democrats, in a 73:18 percent ratio, want bigger government. The independents slightly prefer (47-44 percent) smaller government.
Yet, within the segments that lean toward the Republicans and Democrats, the former group breaks 78-17 percent for smaller government, while the latter cell favors the Democratic bigger government position in a 65:25 percent ratio. Those who say they don’t lean either way favor the Republican position, 47-37 percent.
On the question of whether it is necessary for the government to regulate in order to protect the public interest or that government regulation does more harm than good, the full electorate breaks 49-43 percent in favor of regulation.
Here again, the pattern among Democrats, Republicans, and Independents is similar. While Republicans break 61-33 percent saying that regulation does more harm than good, Democrats see a 65-29 percent split in favor of regulation. The Independent segment goes slightly toward the regulation side, 48-43 percent.
Among the independents who lean toward a party, the pattern is similar. For those who lean toward the Republicans, 58-33 percent agree with the party position. The Democratic leaners adopt that party’s position in a greater 69-27 percent proportion. Those who can be considered the “true” Independents actually back the Republican regulation stance, 49-31 percent.
Differently worded questions might generate slightly different responses, but it can be concluded that large portions of the Independent segment display similar traits as named Republicans and Democrats. Therefore, even among a group that claims to stand for independence and voting individually upon candidates and issues, most of them also appear polarized in similar measure to their more overtly partisan counterparts.
Independents will clearly be a major factor in determining the outcome of the forthcoming 2020 election, but it appears that voter participation remains the key factor in winning their votes — not issue persuasion.