By Jim Ellis
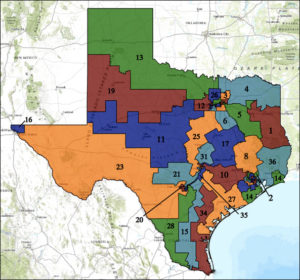
Map of US Congressional districts in Texas
The turnout theory loses its steam when actually comparing the participation numbers not only with 2020 Republican turnout and understanding that the GOP has a virtually unopposed presidential candidate for its nomination, but also when overlaying recent political history.
When studying the numbers, one sees that the 2008 Democratic primary’s participation rate between Barack Obama and Hillary Clinton far exceeded the numbers posted in this year’s primary, which was held on March 3 – Super Tuesday. In 2008, we see that 33.2 percent of the registered voters participated in one of the major party primaries. This year, the combined turnout represented 25.2 percent of the registered voter pool.
And, 12 years ago, according to figures published in this March 6 Texas Tribune article, two-thirds of those voters chose a Democratic ballot to vote in the Obama-Clinton primary versus just one-third who entered the Republican primary to support John McCain over former Arkansas governor, Mike Huckabee.
This year, 12.8 percent of the registered Texas voters chose the Democratic primary versus 12.4 percent who picked a Republican ballot even though there was no competitive GOP contest. Furthermore, the combined 25.2 percent total participation factor is actually the second-lowest turnout in the past four elections.
Most importantly, however, as a gauge toward predicting general election turnout and result, while two-thirds of the 2008 voters chose the Democratic ballot in the primary in the largest percentage turnout of the century, Republican John McCain would later post a 55-44 percent general election victory within the Texas electorate.
While Democratic statewide turnout did exceed the number of Republicans voting early or visiting the polls this year, the difference was minuscule. A total of 2,071,745 individuals voted in the Democratic primary while 2,008,385 participated on the Republican side. Since the presidential race was likely the turnout driver, the fact that a highly charged Democratic primary among several competitive contenders barely out-polled a Republican race where the incumbent president was virtually unopposed is of no tangible significance as a predictor of general election preference.
Yet, in the same primary where a dozen Democrats were vying for the party nomination to oppose Sen. John Cornyn (R) this November, more people, 1,924,822 as compared to 1,839,258, actually voted in the Republican primary for that particular race. This drop-off tells us that over 232,000 people chose the Democratic ballot to only vote in the presidential race.
Below are the primary results for what appear to be the most competitive congressional elections for the fall, highlighting their primary turnout figures.
While Democratic turnout outpaced the Republicans in all but one of the districts, the Republican incumbent races featured an unopposed or lightly contested representative, thus drawing no GOP primary campaign effort. Additionally, it is important to remember that general election turnout will approach three times the numbers these districts produced for the March 3 vote; therefore, using primary turnout figures to predict general election outcome becomes a more difficult and less accurate exercise.
Districts 7 and 32, which are clearly moving toward the Democratic column and now have party incumbents, still outperformed Republican primary turnout with an unopposed representative, which is significant. District 23, which virtually all analyses suggest will move to the Democrats in an open-seat campaign, not surprisingly produced a lopsided turnout ratio.
District 7
Rep. Lizzie Fletcher (D): Unopposed – 54,989 Democratic turnout
Wesley Hunt (R): 61.1% primary victory – 45,798 GOP turnout
District 10
• Primary result led to Democratic runoff – 80,639
Rep. Michael McCaul (R): Unopposed – 60,235
District 21
Wendy Davis (D): 86.2% primary victory – 97,545
Rep. Chip Roy (R): Unopposed – 70,317
District 22 (Rep. Pete Olson-R open seat)
Sri Preston Kulkarni (D): 53.1% primary victory – 65,179
• Primary result led to a Republican runoff – 72,996
District 23 (Rep. Will Hurd-R open seat)
Gina Ortiz Jones (D): 66.8% primary victory – 65,553
• Primary result led to a Republican runoff – 41,062
District 24 (Rep. Kenny Marchant-R open seat)
• Primary result led to Democratic runoff – 58,383
Beth Van Duyne (R): 64.3% primary victory – 49,207
District 31
• Primary result led to Democratic runoff – 69,259
Rep. John Carter (R): 82.3% primary victory – 64,306
District 32
Rep. Colin Allred (D): Unopposed – 68,882
Genevieve Collins (R): 52.6% primary victory – 41,995
